pyfrp.subclasses package
Submodules
pyfrp.subclasses.pyfrp_ROI module
-
class
pyfrp.subclasses.pyfrp_ROI.ROI(embryo, name, Id, zmin='-inf', zmax='inf', color='b')¶ Bases:
object-
adaptRefineInMeshByField(nNodesReq, factor=3.0, addZ=15.0, zIncrement=1.0, fIncrement=1.0, nNodesMax='inf', debug=False, ROIReq=None, fnOut=None)¶ Refines mesh inside ROI adaptively until a given number of nodes inside ROI is reached.
Does this by:
- Refining through
refineInMeshByField(). - Computing mesh indices via
computeMeshIdx(). - If number of nodes did not change, increase
addZ, else increasefactor. - Check if desired number of nodes is reached or not, if not, repeat.
Note
If the new number of nodes in the ROI exceeds
nNodesMax, will revert the last step and perform the other operation, e.g. increasingaddZinstead offactorand vice versa.Note
If
ROIReqis given, will try to refine inselfsuch thatROIReqhas at leastnNodesReqmesh nodes. If it is not given,nNodesReqrefers to the nodes inself.Parameters: nNodesReq (int) – Desired number of nodes inside ROI.
Keyword Arguments: - factor (float) – Refinement factor.
- addZ (float) – Number of pixels added above and below ROI for box field.
- zIncrement (float) – Number of pixels addZ is increased per adaptive step.
- fIncrement (float) – Stepsize of refinement factor.
- nNodesMax (float) – Maximum number of nodes allowed in ROI.
- debug (bool) – Print debugging messages.
- ROIReq (pyfrp.subclasses.pyfrp_ROI.ROI) – The ROI object that is referred to with nNodesReq.
- fnOut (str) – Path to output geo file.
Returns: Final number of nodes in ROI.
Return type: int
- Refining through
-
addBoundaryLayerAtSurfaces(fn=None, segments=48)¶ Adds boundary layer around ROI to the mesh.
Does this by:
- Generating a stl file describing ROI, see also
pyfrp.subclasses.pyfrp_ROI.ROI.render2StlInGeometry(). - Read in stl file as new
pyfrp.modules.pyfrp_gmsh_geometry.domainviapyfrp.modules.pyfrp_gmsh_IO_module.readStlFile(). - Simplify new geometry via
pyfrp.modules.pyfrp_gmsh_geometry.domain.simplifySurfaces(). - Extracting selected surfaces via
pyfrp.modules.pyfrp_gmsh_geometry.gmshElement.extract(). - If selected, surface boundaries are approximated into splines via
pyfrp.modules.pyfrp_gmsh_geometry.gmshElement.extract(). - Reading in geometry’s .geo file via
pyfrp.sublcasses.pyfrp_geometry.geometry.readGeoFile(). - Merging ROI geometry into main geometry via
pyfrp.modules.pyfrp_gmsh_geometry.domain.merge(). - Adding a boundary layer mesh via
pyfrp.modules.pyfrp_gmsh_geometry.domain.addBoundaryLayerField(). - Adding all surfaces of ROI’s domain to boundary layer, see
pyfrp.modules.pyfrp_gmsh_geometry.boundaryLayerField.addFaceListByID(). - Writing new .geo file.
- Setting new .geo file as
fnGeo. - Running
genMesh(). - Clean up .stl and .scad files that are not needed anymore.
Note
volSizeLayeronly allows a single definition of mesh size in layer. Note that thepyfrp.modules.pyfrp_gmsh_geometry.boundaryLayerFieldclass allows different mesh sizes normal and along surfaces. For more information, see its documentation.Note
If no
fnOutis given, will save a new .geo file in same folder as originalfnGeowith subfix:fnGeo_roiName_BL.geo.Note
pyfrp.modules.pyfrp_gmsh_geometry.domain.simplifySurfaces()is not a simple procedure, we recommend reading its documentation.If
volSizePxis given, will overwrite mesh’svolSizePxand set it globally at all nodes.Parameters: roi (pyfrp.subclasses.pyfrp_ROI.ROI) – An ROI.
Keyword Arguments: - fnOut (str) – Path to new .geo file.
- segments (int) – Number of segments used for convex hull of surface.
- simplify (bool) – Simplify surfaces of stl file.
- iterations (int) – Number of iterations used for simplification.
- triangIterations (int) – Number of iterations used for subdivision of surfaces.
- addPoints (bool) – Allow adding points inside surface triangles.
- fixSurfaces (bool) – Allow fixing of surfaces, making sure they are coherent with Gmsh requirements.
- debug (bool) – Print debugging messages.
- volSizePx (float) – Global mesh density.
- volSizeLayer (float) – Boundary layer mesh size.
- thickness (float) – Thickness of boundary layer.
- cleanUp (bool) – Clean up temporary files when finished.
- approxBySpline (bool) – Approximate curvatures by spline.
- angleThresh (float) – Threshold angle under which loops are summarized.
- faces (list) – List of faces.
- onlyAbs (bool) – Take absolute value of faces into account.
Returns: Path to new .geo file.
Return type: str
- Generating a stl file describing ROI, see also
-
checkSymmetry(debug=False)
-
checkZInside(z)
-
computeExtIdx(debug=False)¶ Computes indices of external pixels.
Does this by comparing extended pixels of
selfwith the one of the master ROI.Keyword Arguments: debug (bool) – Print out debugging messages. Returns: Tuple containing: - extImgIdxX (list): External image indices in x direction.
- extImgIdxY (list): External image indices in y direction.
Return type: tuple
-
computeExtMask()¶ Computes mask of extended pixels of ROI.
Mask is a 2D array with the value
1for pixels inside ROI and0elsewhere.Note
Returns
None,None,Noneif there are no extended pixels.Also returns coordinate arrays, since offset of extended mask is not
[0,0]. See also http://docs.scipy.org/doc/numpy/reference/generated/numpy.meshgrid.html .Returns: Tuple containing: - mX (numpy.ndarray): Coordinate array corresponding to pixels of extended mask.
- mY (numpy.ndarray): Coordinate array corresponding to pixels of extended mask.
- extMask (numpy.ndarray): Extended mask.
Return type: tuple
-
computeIdxs(matchMesh=False, debug=False)¶ Computes image and mesh indices of ROI.
Will do this by:
- Compute image indices.
- Match image indices with master ROI.
- Compute external indices.
- Compute mesh indices.
- Match mesh indices with the ones of master ROI.
Note
If no master ROI is defined, will not do anything.
Note
If master ROI has not been indexed yet, will first index it, then continue.
Note
Will skip mesh index computation if there is no mesh generated yet.
Keyword Arguments: - matchMesh (bool) – Match mesh indices with master ROI.
- debug (bool) – Print out debugging messages.
Returns: Tuple containing:
- imgIdxX (list): Image indices in x direction.
- imgIdxY (list): Image indices in y direction.
- meshIdx (list): Mesh indices.
Return type: tuple
-
computeImgMask()¶ Computes image mask of ROI.
Image mask is a
dataResPx * dataResPxarray with the value1for pixels inside ROI and0elsewhere.Returns: Image mask. Return type: numpy.ndarray
-
computeNumExt()¶ Computes number of extended pixels of ROI.
Returns: Number of extended pixels. Return type: int
-
copyIdxs(r)¶ Copies indices of other ROI and inserts them into ROI.
Parameters: r (pyfrp.subclasses.pyfrp_ROI.ROI) – ROI to take indices from. Returns: Tuple containing: - imgIdxX (list): Image indices in x-direction.
- imgIdxY (list): Image indices in y-direction.
- meshIdx (list): Mesh indices.
Return type: tuple
-
emptyIdxs()¶ Flushes all indices, inserting empty lists for all of them.
Returns: Tuple containing: - imgIdxX (list): Image indices in x-direction.
- imgIdxY (list): Image indices in y-direction.
- meshIdx (list): Mesh indices.
Return type: tuple
-
findIncluded()¶ Returns list of
pyfrp.subclasses.pyfrp_ROI.customROIobjects in which ROI is included.Returns: List of customROIs. Return type: list
-
genAsOpenscadInGeometry()¶ Generates intersection between ROI and geometry as solid python object.
See also
pyfrp.subclasses.pyfrp_geometry.geometry.genAsOpenscad()andpyfrp.subclasses.pyfrp_ROI.ROI.genAsOpenscad().Returns: Solid python object. Return type: solid.solidpython.cylinder
-
genGmshDomain(volSizePx=20.0, genLoops=True, genSurfaces=True, genVol=True, minID=None)¶ Translates ROI into gmsh domain object.
This object can then be used to write ROIs to
.geofiles.Note
If
minID==None, will grab maximum ID viapyfrp.subclasses.pyfrp_geometry.geometry.getMaxGeoID()and add 1.Keyword Arguments: - volSizePx (float) – Mesh size of vertices.
- genLoops (bool) – Generate line loops.
- genSurfaces (bool) – Generate surfaces.
- genVol (bool) – Generate surface loop and corresponding volume.
- minID (int) – Id at which geo IDs should start.
Returns: Domain object.
Return type:
-
genMeshFile(fn=None, volSizePx=20.0, debug=False, minID=None)¶ Writes ROI to geo file.
Note
If
fnis not given, will save .msh file of ROI in same folder as the geometry file of the embryo with the following path:path/to/embryos/geo/file/nameOfEmbryo_nameOfROI.msh.See also
pyfrp.subclasses.pyfrp_ROI.polySliceROI.writeToGeoFile().Keyword Arguments: - volSizePx (float) – Mesh size of vertices.
- genLoops (bool) – Generate line loops.
- genSurfaces (bool) – Generate surfaces.
- genVol (bool) – Generate surface loop and corresponding volume.
- minID (int) – Id at which geo IDs should start.
Returns: Path to mesh file.
Return type: str
-
getAllIdxs()¶ Returns all index arrays of ROI.
Returns: Tuple containing: - imgIdxX (list): Image indices in x-direction.
- imgIdxY (list): Image indices in y-direction.
- meshIdx (list): Mesh indices.
Return type: tuple
-
getArea()¶ Returns area of ROI.
Area is computed as area covered by
imgMask + extMaskReturns: Area of ROI. Return type: float
-
getColor()¶ Returns color of ROI.
-
getCopy()¶ Returns deepcopy of ROI object.
Uses
copy.copyto generate copy of object, see also https://docs.python.org/2/library/copy.html .copy.deepcopyalso generates copies of other objects, includingROI.embryo.
-
getDataVec()¶ Returns current data vector of ROI.
Returns: Current data vector. Return type: numpy.ndarray
-
getEncapsulatingBox()¶ Returns encapsulating box of ROI.
That is, a box defined by
[xmin,xmax],[ymin,ymax],[zmin,zmax]in which ROI lies fully within.Returns: Tuple containing: - xExtend (list): List describing extend in x-direction (
[xmin,xmax]). - yExtend (list): List describing extend in y-direction (
[ymin,ymax]). - zExtend (list): List describing extend in z-direction (
[zmin,zmax]).
Return type: tuple - xExtend (list): List describing extend in x-direction (
-
getExtImgIdx()¶ Returns extended image indices of ROI.
Returns: Tuple containing: - extImgIdxX (list): Extended image indices in x-direction.
- extImgIdxY (list): Extended image indices in y-direction.
Return type: tuple
-
getExtMask()¶ Returns extended mask of ROI.
Returns: Extended mask. Return type: numpy.ndarray
-
getExtend()¶ Returns x-/y-/z-extend of ROI.
Returns: Tuple containing: - xmin (float): Minimum x-coordinate.
- xmax (float): Maximum x-coordinate.
- ymin (float): Minimum y-coordinate.
- ymax (float): Maximum y-coordinate.
- zmin (float): Minimum z-coordinate.
- zmax (float): Maximum z-coordinate.
Return type: tuple
-
getFittedVec(fit)¶ Returns fitted simulation vector of ROI of given fit.
Note
To avoid crashes, function returns empty list if ROI is in
ROIsFIttedbut has not been fitted yet. Also inserts an empty list at the respective index.Parameters: fit (pyfrp.subclasses.pyfrp_fit) – Fit object. Returns: Fitted simulation vector. Return type: numpy.ndarray
-
getId()¶ Returns Id of ROI.
Returns: Id. Return type: int
-
getImgIdx()¶ Returns image indices of ROI.
Returns: Tuple containing: - imgIdxX (list): Image indices in x-direction.
- imgIdxY (list): Image indices in y-direction.
Return type: tuple
-
getImgMask()¶ Returns image mask of ROI.
Returns: Image mask. Return type: numpy.ndarray
-
getInterpolationError()¶ Prints out interpolation error for the volume of this ROI.
Interpolation error is defined as:
dataVec[0]/simVec[0],That is, by how much does the first simulation value defer from first data value.
Returns: Interpolation error. Return type: float
-
getMaxExtendPlane()¶ Returns in which plane (“xy”,”xz”,”yz”) the ROI has the biggest extend.
Returns: Plane with largest extend. Return type: str
-
getMaxNodeDistance()¶ Returns maximum node distance in x/y/z direction for all nodes in ROI.
Returns: Tuple containing: - dmaxX (float): Maximum distance in x-direction
- dmaxY (float): Maximum distance in y-direction
- dmaxZ (float): Maximum distance in z-direction
Return type: tuple
-
getMeshDensity()¶ Returns average mesh density inside ROI.
Mesh density is defined by
\[\rho=N/V,\]where \(N\) is the number of mesh nodes inside ROI and \(V\) is the volume of ROI, see also
getVolume().Returns: Mesh density. Return type: float
-
getMeshIdx()¶ Returns mesh indices of ROI.
Returns: Mesh indices of ROI. Return type: list
-
getMeshIdxExtend()¶ Returns extend of ROI’s
meshIdx.Returns: Tuple containing: - (float): Minimum x-coordinate.
- (float): Maximum x-coordinate.
- (float): Minimum y-coordinate.
- (float): Maximum y-coordinate.
- (float): Minimum z-coordinate.
- (float): Maximum z-coordinate.
Return type: tuple
-
getMeshIdxXExtend()¶ Returns extend of ROI’s
meshIdxin x-coordinate.Returns: Tuple containing: - (float): Minimum x-coordinate.
- (float): Maximum x-coordinate.
Return type: tuple
-
getMeshIdxYExtend()¶ Returns extend of ROI’s
meshIdxin y-coordinate.Returns: Tuple containing: - (float): Minimum y-coordinate.
- (float): Maximum y-coordinate.
Return type: tuple
-
getMeshIdxZExtend()¶ Returns extend of ROI’s
meshIdxin z-coordinate.Returns: Tuple containing: - (float): Minimum z-coordinate.
- (float): Maximum z-coordinate.
Return type: tuple
-
getNImgPxs()¶ Returns number of image pixels inside ROI.
Returns: Number of indices. Return type: int
-
getNMeshNodes()¶ Returns number of mesh indices inside ROI.
Returns: Number of nodes. Return type: int
-
getName()¶ Returns name of ROI.
Returns: Current name. Return type: str
-
getNumExt()¶ Returns number of extended pixels of ROI.
Returns: Number of extended pixels. Return type: int
-
getOpenscadZExtend()¶ Returns extend in z-direction suitable for rendering the ROI via openscad.
If either
zminorzmaxis infinity, then uses :py:func:getRealZExend to return more meaningful extend.Returns: Z-extend given by [zmin,zmax].Return type: list
-
getOrthogonal2Plane()¶ Returns orthogonal direction to plane of maximum extension.
See also
pyfrp.subclasses.pyfrp_ROI.ROI.getPlaneMidCoordinate()andpyfrp.subclasses.pyfrp_ROI.ROI.getMaxExtendPlane().Returns: Direction. Return type: str
-
getPlaneMidCoordinate()¶ Returns midpoint of extend orthogonal to plane of maximum extension.
Returns: Midpoint. Return type: float
-
getROIHeight()¶ Returns height of ROI.
Returns: Height of ROI. Return type: float
-
getRealZExend()¶ Returns real extend in z-direction.
Real extend returns
\[z_{\mathrm{min}}=\mathrm{max} (z_{\mathrm{min,ROI}},z_{\mathrm{min,geometry}})\]and
\[z_{\mathrm{max}}=\mathrm{min} (z_{\mathrm{max,ROI}},z_{\mathrm{max,geometry}})\]Returns: Z-extend given by [zmin,zmax].Return type: list
-
getSimConc(phi, append=True)¶ Computes the simulation concentration over ROI.
Parameters: phi (fipy.CellVariable) – Solution variable. Keyword Arguments: append (bool) – Append result to simulation vector. Returns: Simulation concentration over ROI. Return type: float
-
getSimVec()¶ Returns current simulation vector of ROI.
Returns: Current simulation vector. Return type: numpy.ndarray
-
getType()¶ Returns type of ROI, splitting off all module names etc. .
Returns: Type of ROI. Return type: str
-
getUseForRim()¶ Returns if the ROI is used for rim calculation.
Returns: Current flag value. Return type: bool
-
getVolume()¶ Returns volume of ROI.
Since ROIs only behave linearly in z-direction, volume is given by
\[V = A * h,\]where \(h\) is ROI height (see
getROIHeight()) and \(A\) is ROI area (seegetArea()).Returns: ROI volume. Return type: float
-
getZExtend()¶ Returns extend in z-direction.
Returns: Z-extend given by [zmin,zmax].Return type: list
-
getdataVecFitted(fit)¶ Returns fitted data vector of ROI of given fit.
Note
To avoid crashes, function returns empty list if ROI is in
ROIsFIttedbut has not been fitted yet. Also inserts an empty list at the respective index.Parameters: fit (pyfrp.subclasses.pyfrp_fit) – Fit object. Returns: Fitted data vector. Return type: numpy.ndarray
-
idxs2Full()
-
idxs2Quad(debug=False)
-
isAnalyzed()¶ Checks if ROI has been analyzed.
Returns: True if ROI has been analyzed. Return type: bool
-
isFitted()¶ Checks if ROI has been fitted in ALL fits of embryo.
Returns: True if ROI has been fitted. Return type: bool
-
isMaster()¶ Returns if ROI is masterROI.
Returns: True if masterROI. Return type: bool
-
isSimulated()¶ Checks if ROI has been simulated.
Returns: True if ROI has been simulated. Return type: bool
-
matchImgIdx(r)¶ Matches image indices of
selfwith the ones of ROIr.Does this by generating masks of both ROIs and multiplicating them.
Parameters: r (pyfrp.subclasses.pyfrp_ROI.ROI) – ROI to match with. Returns: Tuple containing: - imgIdxX (list): Matched image indices in x direction.
- imgIdxY (list): Matched image indices in y direction.
Return type: tuple
-
matchMeshIdx(r, matchZ=False)
-
pinAllTS(bkgdVal=None, normVal=None, bkgdValSim=None, normValSim=None, debug=False)¶ Pins both data and simulation timeseries of ROI.
See also
pyfrp.modules.pyfrp_fit_module.pinConc().Keyword Arguments: - bkgdVal (float) – Use this background value instead of newly computing it.
- normVal (float) – Use this norming value instead of newly computing it.
- bkgdValSim (float) – Use this background value for simulation timeseries instead of newly computing it.
- normValSim (float) – Use this norming value for simulation timeseries instead of newly computing it.
- debug (bool) – Print debugging messages.
Returns: Tuple containing:
- dataVecPinned (numpy.ndarray): Pinned data vector.
- simVecPinned (numpy.ndarray): Pinned simulation vector.
Return type: tuple
-
pinDataTS(bkgdVal=None, normVal=None, debug=False)¶ Pins data timeseries of ROI.
See also
pyfrp.modules.pyfrp_fit_module.pinConc().Keyword Arguments: - bkgdVal (float) – Use this background value instead of newly computing it.
- normVal (float) – Use this norming value instead of newly computing it.
- debug (bool) – Print debugging messages.
Returns: Pinned data vector.
Return type: numpy.ndarray
-
pinSimTS(bkgdVal=None, normVal=None, debug=False)¶ Pins simulation timeseries of ROI.
See also
pyfrp.modules.pyfrp_fit_module.pinConc().Keyword Arguments: - bkgdVal (float) – Use this background value instead of newly computing it.
- normVal (float) – Use this norming value instead of newly computing it.
- debug (bool) – Print debugging messages.
Returns: Pinned simulation vector.
Return type: numpy.ndarray
-
plotData(ax=None, color=None, linewidth=1, legend=True, linestyle='-', label=None, legLoc=-1)¶ Plot data vector of ROI.
If no color is specified, will use color specified in
ROI.color.Keyword Arguments: - ax (matplotlib.axes) – Matplotlib axes used for plotting. If not specified, will generate new one.
- color (str) – Color of plot.
- linestyle (str) – Linestyle of plot.
- linewidth (float) – Linewidth of plot.
- legend (bool) – Show legend.
- legLoc (int) – Location of legend.
Returns: Axes used for plotting.
Return type: matplotlib.axes
-
plotDataPinned(ax=None, color=None, linewidth=1, legend=True, linestyle='-', label=None, legLoc=-1)¶ Plot pinned data vector of ROI.
If no color is specified, will use color specified in
ROI.color.Keyword Arguments: - ax (matplotlib.axes) – Matplotlib axes used for plotting. If not specified, will generate new one.
- color (str) – Color of plot.
- linestyle (str) – Linestyle of plot.
- linewidth (float) – Linewidth of plot.
- legend (bool) – Show legend.
- legLoc (int) – Location of legend.
Returns: Axes used for plotting.
Return type: matplotlib.axes
-
plotFit(fit, ax=None, color=None, linewidth=1, legend=True, title=None, linestyles=['-', '-.'], show=True)¶ Plot fit for ROI.
If no color is specified, will use color specified in
ROI.color.Keyword Arguments: - ax (matplotlib.axes) – Matplotlib axes used for plotting. If not specified, will generate new one.
- color (str) – Color of plot.
- linestyles (list) – Linestyles of data and simulation.
- linewidth (float) – Linewidth of plot.
- legend (bool) – Show legend.
- show (bool) – Show figure.
Returns: Axes used for plotting.
Return type: matplotlib.axes
-
plotSim(ax=None, color=None, linewidth=1, legend=True, linestyle='--', label=None, legLoc=-1)¶ Plot simulation vector of ROI.
If no color is specified, will use color specified in
ROI.color.Keyword Arguments: - ax (matplotlib.axes) – Matplotlib axes used for plotting. If not specified, will generate new one.
- color (str) – Color of plot.
- linestyle (str) – Linestyle of plot.
- linewidth (float) – Linewidth of plot.
- legend (bool) – Show legend.
- legLoc (int) – Location of legend.
Returns: Axes used for plotting.
Return type: matplotlib.axes
-
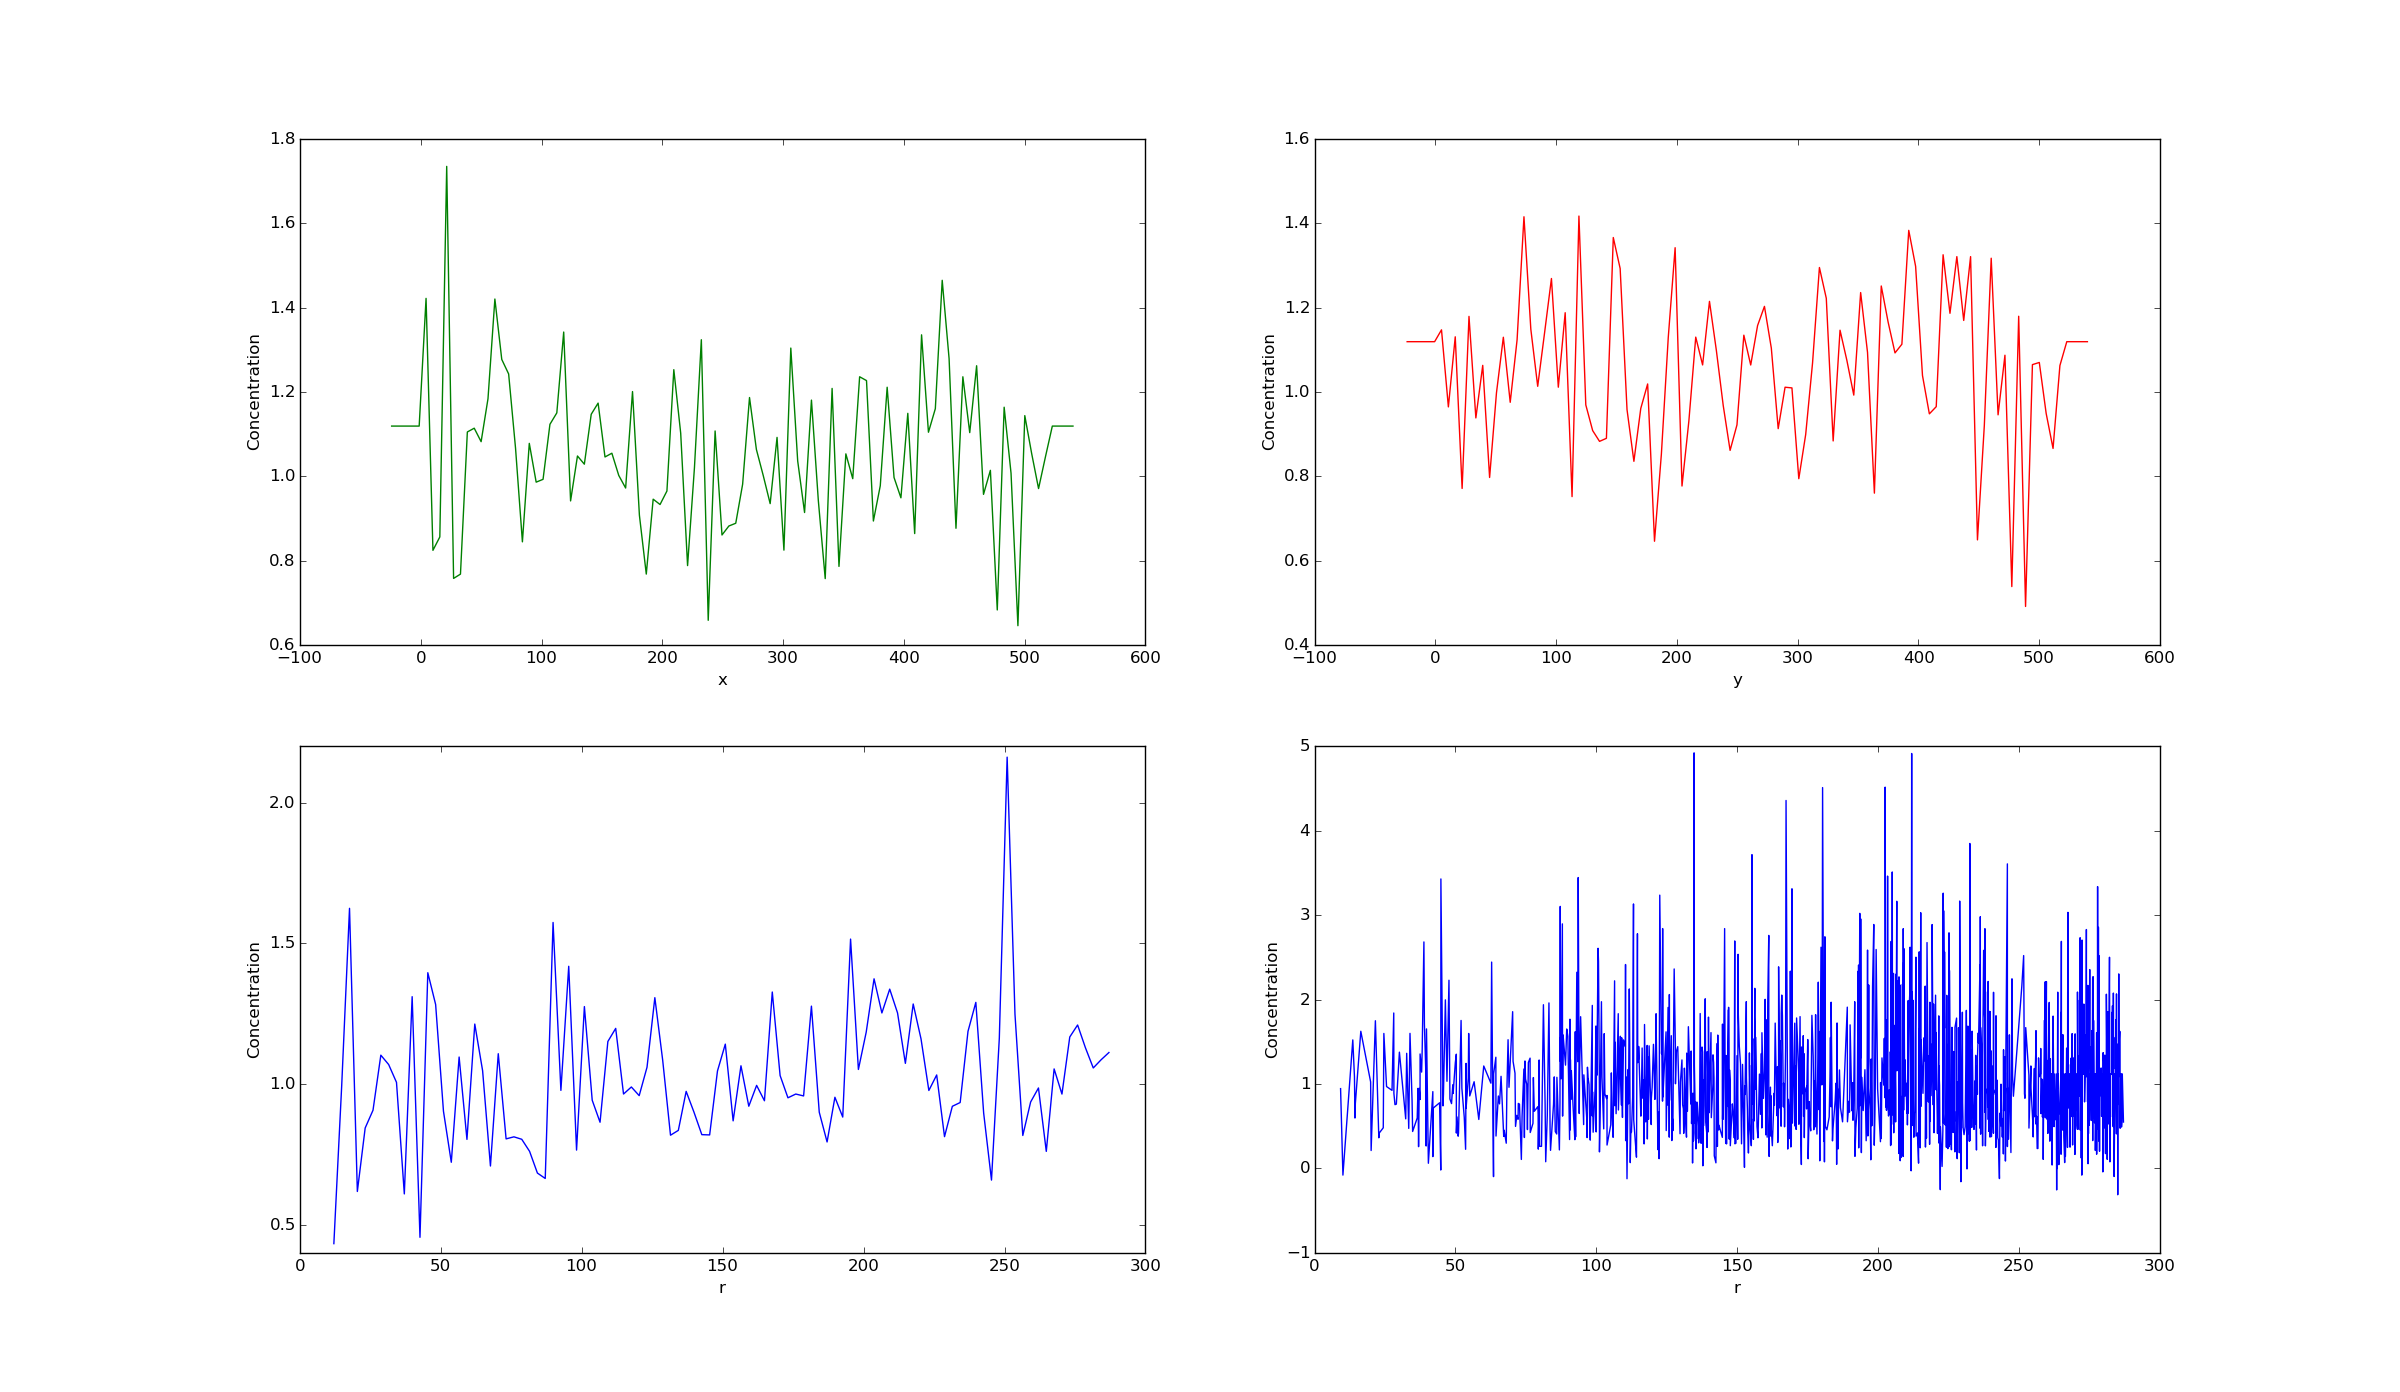
plotSimConcProfile(phi, ax=None, direction='x', mode='normal', nbins=20, color=None, label=None, legend=False)¶ Plots concentration profile of solution variable in single direction.
modecan be either"normal"or"hist". Ifmode="hist", will plot a histogram withnbinsbins usingpyfrp.modules.pyfrp_misc_module.simpleHist().Note
directionsets in which direction the profile should be plotted. ifdirection="r", then function will plot a radial profile and usesself.embryo.geometry.centeras center if ROI does not have a center, else uses center of ROI.Note
Will create axes if not given via
ax.Example:
Grab ROI:
>>> sl=emb.getROIByName("Slice")
Make some plot:
>>> fig,axes=pyfrp_plot_module.makeSubplot([2,2])
Plot some concentration profiles:
>>> ax=sl.plotSimConcProfile(emb.simulation.IC,mode='hist',color='g',label='direction = x',nbins=100,ax=axes[0],legend=False)
>>> ax=sl.plotSimConcProfile(emb.simulation.IC,mode='hist',direction='y',color='r',label='direction = y',nbins=100,ax=axes[1],legend=False)
>>> ax=sl.plotSimConcProfile(emb.simulation.IC,mode='hist',direction='r',color='b',nbins=100,label='direction = r',ax=axes[2],legend=False)
>>> ax=sl.plotSimConcProfile(emb.simulation.IC,mode='normal',direction='r',color='b',label='direction = r',ax=axes[3],legend=False)
Parameters: phi (fipy.CellVariable) – Solution variable
Keyword Arguments: - ax (matplotlib.axes) – Axes to be plotted in.
- direction (str) – Direction to be plotted (x/y/z/r).
- color (str) – Color of plot.
- legend (bool) – Show legend.
- label (str) – Label of plot.
- nbins (int) – Number of bins of histogram.
- mode (str) – Either
normalorhist.
Returns: Matplotlib axes used for plotting.
Return type: matplotlib.axes
-
plotSimPinned(ax=None, color=None, linewidth=1, legend=True, linestyle='--', label=None, legLoc=-1)¶ Plot pinned simulation vector of ROI.
If no color is specified, will use color specified in
ROI.color.Keyword Arguments: - ax (matplotlib.axes) – Matplotlib axes used for plotting. If not specified, will generate new one.
- color (str) – Color of plot.
- linestyle (str) – Linestyle of plot.
- linewidth (float) – Linewidth of plot.
- legend (bool) – Show legend.
- legLoc (int) – Location of legend.
Returns: Axes used for plotting.
Return type: matplotlib.axes
-
plotSolutionVariable(phi, ax=None, vmin=None, vmax=None, nlevels=25, colorbar=True, plane='xy', zs=None, zdir=None, mask=True, nPts=1000, mode='normal', title='Solution Variable', typ='contour')¶ Plots simulation solution variable over all indices of ROI as 2D contour plot.
Note
If no
axis given, will create new one.planevariable controls in which plane the solution variable is supposed to be plotted. Acceptable input variables are"xy","xz","yz". See alsopyfrp.subclasses.pyfrp_ROI.ROI.getMaxExtendPlane().See also http://matplotlib.org/api/pyplot_api.html#matplotlib.pyplot.tricontourf .
Warning
matplotlib.pyplot.tricontourfhas problems whenphionly is in a single level of contour plot. To avoid this, we currently add some noise in this case just to make it plottable. This is not the most elegant solution.You can find a more detailed explanation in the documentation of
pyfrp.modules.pyfrp_plot_module.plotSolutionVariable().Parameters: phi (fipy.CellVariable) – Solution variable.
Keyword Arguments: - ax (matplotlib.axes) – Axes used for plotting.
- vmin (float) – Minimum value displayed in contour plot.
- vmax (float) – Maximum value displayed in contour plot.
- nlevels (int) – Number of contour levels.
- colorbar (bool) – Display color bar.
- plane (str) – Plane in which solution variable is supposed to be plotted.
- zs (float) – In case of a 3D plot, height in direction zdir where to put contour.
- zdir (str) – Orthogonal direction to plane.
- nPts (int) – Number of points used for interpolating (only if
mode=normal). - mode (str) – Which contour function to use.
- title (str) – Title of plot.
- typ (str) – Type of plot.
Returns: Axes used for plotting.
Return type: matplotlib.axes
-
printDetails()¶ Prints out all attributes of ROI object.
-
refineInMeshByField(factor=3.0, addZ=15.0, findIdxs=True, debug=False, run=True, fnOut=None)¶ Refines mesh inside ROI by adding box field to mesh file.
The mesh size inside the box is computed by
mesh.volSizePx/factor. To ensure that there are enough original nodes inside ROI that then allow refinement from,addZpixels is added in z-direction both below and above the ROI.See also
pyfrp.subclasses.pyfrp_mesh.mesh.addBoxField().Keyword Arguments: - factor (float) – Refinement factor.
- addZ (float) – Number of pixels added above and below ROI for box field.
- findIdxs (bool) – Find mesh indices of ROI after refinement.
- run (bool) – Run Gmsh to generate new mesh after refinement.
- debug (bool) – Print debugging messages.
- fnOut (str) – Path to output geo file.
Returns: Path to new .geo file.
Return type: str
-
render2Openscad(fn=None, segments=48)¶ Generates .scad file for the ROI.
Note
If
fnis not given, will save .scad file of ROI in same folder as the geometry file of the embryo with the following path:path/to/embryos/geo/file/nameOfEmbryo_nameOfROI.scad.Keyword Arguments: - fn (str) – Output filename.
- segments (int) – Number of segments used for convex hull of surface.
Returns: Output filename.
Return type: str
-
render2OpenscadInGeometry(fn=None, segments=48)¶ Generates .scad file for the intersection between ROI and geometry.
Note
If
fnis not given, will save .scad file of ROI in same folder as the geometry file of the embryo with the following path:path/to/embryos/geo/file/nameOfEmbryo_nameOfROI.scad.Keyword Arguments: - fn (str) – Output filename.
- segments (int) – Number of segments used for convex hull of surface.
Returns: Output filename.
Return type: str
-
render2Stl(fn=None, segments=48)¶ Generates .stl file for the ROI.
Will do this by:
- Generating openscad object via
genAsOpenscad(). - Rendering this to scad file via
render2Openscad(). - Calling
pyfrp.modules.pyfrp_openscad_module.runOpenscad().
Note
If
fnis not given, will save .stl file of ROI in same folder as the geometry file of the embryo with the following path:path/to/embryos/geo/file/nameOfEmbryo_nameOfROI.stl.Keyword Arguments: - fn (str) – Output filename.
- segments (int) – Number of segments used for convex hull of surface.
Returns: Output filename.
Return type: str
- Generating openscad object via
-
render2StlInGeometry(fn=None, segments=48)¶ Generates .stl file for the intersection between ROI and geometry.
Will do this by:
- Generating openscad object via
genAsOpenscadInGeometry(). - Rendering this to scad file via
render2OpenscadInGeometry(). - Calling
pyfrp.modules.pyfrp_openscad_module.runOpenscad().
Note
If
fnis not given, will save .stl file of ROI in same folder as the geometry file of the embryo with the following path:path/to/embryos/geo/file/nameOfEmbryo_nameOfROI.stl.Keyword Arguments: - fn (str) – Output filename.
- segments (int) – Number of segments used for convex hull of surface.
Returns: Output filename.
Return type: str
- Generating openscad object via
-
resetDataVec()¶ Resets data vector to an empty list
-
resetSimVec()¶ Resets simulation vector to an empty list
-
setColor(color)¶ Sets color of ROI.
Color can be either
str,floatortuple. See also: http://matplotlib.org/api/colors_api.htmlParameters: color (str) – New color. Returns: New color. Return type: str
-
setDataVec(vec)¶ Sets data vector of ROI.
Parameters: vec (numpy.ndarray) – New data vector. Returns: New data vector. Return type: numpy.ndarray
-
setId(Id)¶ Sets Id of ROI.
Parameters: Id (int) – New Id. Returns: New Id. Return type: int
-
setName(n)¶ Sets name of ROI.
Parameters: n (str) – New name. Returns: New name. Return type: str
-
setSimVec(vec)¶ Sets simulation vector of ROI.
Parameters: vec (numpy.ndarray) – New simulation vector. Returns: New simulation vector. Return type: numpy.ndarray
-
setUseForRim(b)¶ Marks the ROI to be used for rim calculation.
Parameters: b (bool) – True if ROI should be used, False else. Returns: Current flag value. Return type: bool
-
setZExtend(zmin, zmax)¶ Sets extend in z-direction.
Parameters: - zmin (float) – Minimum z-coordinate.
- zmax (float) – Maximum z-coordinate.
Returns: New z-extend given by
[zmin,zmax].Return type: list
-
showExtImgIdx(ax=None)
-
showIdxs(axes=None)
-
showImgIdx(ax=None)
-
showMeshIdx(ax=None)
-
showMeshIdx2D(ax=None)
-
writeToGeoFile(fn=None, volSizePx=20.0, genLoops=True, genSurfaces=True, genVol=True, minID=None)¶ Writes ROI to geo file.
Note
If
fnis not given, will save .geo file of ROI in same folder as the geometry file of the embryo with the following path:path/to/embryos/geo/file/nameOfEmbryo_nameOfROI.geo.See also
pyfrp.subclasses.pyfrp_ROI.polySliceROI.genGmshDomain().Keyword Arguments: - volSizePx (float) – Mesh size of vertices.
- genLoops (bool) – Generate line loops.
- genSurfaces (bool) – Generate surfaces.
- genVol (bool) – Generate surface loop and corresponding volume.
- minID (int) – Id at which geo IDs should start.
Returns: Path to geo file.
Return type: str
-
-
class
pyfrp.subclasses.pyfrp_ROI.customROI(embryo, name, Id, color='b')¶ Bases:
pyfrp.subclasses.pyfrp_ROI.ROI-
addROI(r, p)
-
checkXYInside(x, y)¶ Checks if coordinates are inside ROI.
Does this by looping through all ROIs specified in
ROIsIncludedand checking if x/y is supposed to lie inside or outside of the respective ROI.Parameters: - x (np.ndarray) – Array of x-coordinates.
- y (np.ndarray) – Array of y-coordinates.
Returns: Array of booleans with corresponding to [x,y].
Return type: np.ndarray
-
computeXYExtend()¶ Computes extend of ROI in x/y direction.
Returns: Tuple containing: - xExtend (list): List containing minimum/maximum x-coordinate (
[xmin,xmax]). - yExtend (list): List containing minimum/maximum y-coordinate (
[ymin,ymax]).
Return type: tuple - xExtend (list): List containing minimum/maximum x-coordinate (
-
genAsOpenscad()¶ Generates ROI as solid python object.
Useful if ROI is used to be passed to openscad.
Returns: Solid python object. Return type: solid.solidpython.openscad_object
-
getROIsIncluded()
-
mergeROIs(r)
-
removeROI(r)
-
roiIncluded(r)¶ Returns if a ROI is included in customROI.
Parameters: r (pyfrp.subclasses.pyfrp_ROI.ROI) – A ROI. Returns: Trueif included,Falseelse.Return type: bool
-
setROIsIncluded(l)
-
showBoundary(color=None, linewidth=3, ax=None)¶ Shows ROI in a 2D plot by plotting all included ROIs.
If no color is specified, will use color specified in
ROI.color. Ifcolor=="each", will plot each included ROI in its respective color.Keyword Arguments: - ax (matplotlib.axes) – Matplotlib axes used for plotting. If not specified, will generate new one.
- color (str) – Color of plot.
- linewidth (float) – Linewidth of plot.
Returns: Axes used for plotting.
Return type: matplotlib.axes
-
substractROIs(r)
-
updateIdxs()
-
-
class
pyfrp.subclasses.pyfrp_ROI.polyROI(embryo, name, Id, corners, color='b')¶ Bases:
pyfrp.subclasses.pyfrp_ROI.ROI-
addCorner(c, pos=-1)
-
appendCorner(c)
-
checkXYInside(x, y)¶ Checks if coordinates are inside ROI.
See also
pyfrp.modules.pyfrp_idx_module.checkInsidePoly().Parameters: - x (np.ndarray) – Array of x-coordinates.
- y (np.ndarray) – Array of y-coordinates.
Returns: Array of booleans with corresponding to [x,y].
Return type: np.ndarray
-
computeImgIdx(debug=False)¶ Computes image indices of ROI.
See also
pyfrp.modules.pyfrp_idx_module.getPolyIdxImg().Keyword Arguments: debug (bool) – Print debugging messages. Returns: Tuple containing: - imgIdxX (list): Image indices in x-direction.
- imgIdxY (list): Image indices in y-direction.
Return type: tuple
-
computeMeshIdx(mesh)¶ Computes mesh indices of ROI.
See also
pyfrp.modules.pyfrp_idx_module.getPolyIdxMesh().Parameters: mesh (fipy.GmshImporter3D) – Fipy mesh object. Returns: Newly computed mesh indices. Return type: list
-
computeXYExtend()¶ Computes extend of ROI in x/y direction.
Returns: Tuple containing: - xExtend (list): List containing minimum/maximum x-coordinate (
[xmin,xmax]). - yExtend (list): List containing minimum/maximum y-coordinate (
[ymin,ymax]).
Return type: tuple - xExtend (list): List containing minimum/maximum x-coordinate (
-
genAsOpenscad()¶ Generates ROI as solid python object.
Useful if ROI is used to be passed to openscad.
Returns: Solid python object. Return type: solid.solidpython.linear_extrude
-
getCenterOfMass()¶ Computes center of mass of ROI.
The center of mass is computed by
\[c = \frac{1}{N} \sum\limits_{i=1}{N} x_i ,\]where \(c\) is the center of mass, \(N\) the number of corners and \(x_i\) is the coordinate of corner \(i\) .
Returns: Center of mass. Return type: numpy.ndarray
-
getCorners()
-
moveCorner(idx, x, y)¶ Moves corner to new postion.
Parameters: - idx (int) – Index of corner to be moved.
- x (float) – New x-coordinate.
- y (float) – New y-coordinate.
- Results:
- list: Updated corners list.
-
removeCorner(pos)
-
setCorners(corners)
-
showBoundary(color=None, linewidth=3, ax=None)¶ Shows ROI in a 2D plot.
If no color is specified, will use color specified in
ROI.color.Keyword Arguments: - ax (matplotlib.axes) – Matplotlib axes used for plotting. If not specified, will generate new one.
- color (str) – Color of plot.
- linewidth (float) – Linewidth of plot.
Returns: Axes used for plotting.
Return type: matplotlib.axes
-
-
class
pyfrp.subclasses.pyfrp_ROI.polySliceROI(embryo, name, Id, corners, height, width, sliceBottom, color='b')¶ Bases:
pyfrp.subclasses.pyfrp_ROI.polyROI,pyfrp.subclasses.pyfrp_ROI.sliceROI-
checkXYInside(x, y)¶ Checks if coordinates are inside ROI.
See also
pyfrp.modules.pyfrp_idx_module.checkInsidePoly().Parameters: - x (np.ndarray) – Array of x-coordinates.
- y (np.ndarray) – Array of y-coordinates.
Returns: Array of booleans with corresponding to [x,y].
Return type: np.ndarray
-
computeImgIdx(debug=False)¶ Computes image indices of ROI.
See also
pyfrp.modules.pyfrp_idx_module.getPolyIdxImg().Keyword Arguments: debug (bool) – Print debugging messages. Returns: Tuple containing: - imgIdxX (list): Image indices in x-direction.
- imgIdxY (list): Image indices in y-direction.
Return type: tuple
-
computeMeshIdx(mesh)¶ Computes mesh indices of ROI.
See also
pyfrp.modules.pyfrp_idx_module.getPolyIdxMesh().Parameters: mesh (fipy.GmshImporter3D) – Fipy mesh object. Returns: Newly computed mesh indices. Return type: list
-
computeXYExtend()¶ Computes extend of ROI in x/y direction.
Returns: Tuple containing: - xExtend (list): List containing minimum/maximum x-coordinate (
[xmin,xmax]). - yExtend (list): List containing minimum/maximum y-coordinate (
[ymin,ymax]).
Return type: tuple - xExtend (list): List containing minimum/maximum x-coordinate (
-
genAsOpenscad()¶ Generates ROI as solid python object.
Useful if ROI is used to be passed to openscad.
Returns: Solid python object. Return type: solid.solidpython.linear_extrude
-
genGmshDomain(volSizePx=20.0, genLoops=True, genSurfaces=True, genVol=True, minID=None)¶ Translates ROI into gmsh domain object.
This object can then be used to write ROIs to
.geofiles.See also
pyfrp.modules.pyfrp_gmsh_geometry.domain.addPrismByParameters().Note
If
minID==None, will grab maximum ID viapyfrp.subclasses.pyfrp_geometry.geometry.getMaxGeoID()and add 1.Keyword Arguments: - volSizePx (float) – Mesh size of vertices.
- genLoops (bool) – Generate line loops.
- genSurfaces (bool) – Generate surfaces.
- genVol (bool) – Generate surface loop and corresponding volume.
- minID (int) – Id at which geo IDs should start.
Returns: Domain object.
Return type:
-
writeToGeoFile(fn=None, volSizePx=20.0, genLoops=True, genSurfaces=True, genVol=True, minID=None)¶ Writes ROI to geo file.
Note
If
fnis not given, will save .geo file of ROI in same folder as the geometry file of the embryo with the following path:path/to/embryos/geo/file/nameOfEmbryo_nameOfROI.geo.See also
pyfrp.subclasses.pyfrp_ROI.polySliceROI.genGmshDomain().Keyword Arguments: - volSizePx (float) – Mesh size of vertices.
- genLoops (bool) – Generate line loops.
- genSurfaces (bool) – Generate surfaces.
- genVol (bool) – Generate surface loop and corresponding volume.
- minID (int) – Id at which geo IDs should start.
Returns: Path to geo file.
Return type: str
-
-
class
pyfrp.subclasses.pyfrp_ROI.radialROI(embryo, name, Id, center, radius, color='b')¶ Bases:
pyfrp.subclasses.pyfrp_ROI.ROIRadial ROI class.
Inherits from
ROI.Main attributes are:
radius: Radius of ROI.center: Center of ROI.
-
center2Mid()
-
checkCentered()
-
checkXYInside(x, y)¶ Checks if coordinates are inside ROI.
See also
pyfrp.modules.pyfrp_idx_module.checkInsideCircle().Parameters: - x (np.ndarray) – Array of x-coordinates.
- y (np.ndarray) – Array of y-coordinates.
Returns: Array of booleans with corresponding to [x,y].
Return type: np.ndarray
-
computeImgIdx(debug=False)¶ Computes image indices of ROI.
See also
pyfrp.modules.pyfrp_idx_module.getCircleIdxImg().Keyword Arguments: debug (bool) – Print debugging messages. Returns: Tuple containing: - imgIdxX (list): Image indices in x-direction.
- imgIdxY (list): Image indices in y-direction.
Return type: tuple
-
computeMeshIdx(mesh)¶ Computes mesh indices of ROI.
See also
pyfrp.modules.pyfrp_idx_module.getCircleIdxMesh().Parameters: mesh (fipy.GmshImporter3D) – Fipy mesh object. Returns: Newly computed mesh indices. Return type: list
-
computeXYExtend()¶ Computes extend of ROI in x/y direction.
Returns: Tuple containing: - xExtend (list): List containing minimum/maximum x-coordinate (
[xmin,xmax]). - yExtend (list): List containing minimum/maximum y-coordinate (
[ymin,ymax]).
Return type: tuple - xExtend (list): List containing minimum/maximum x-coordinate (
-
genAsOpenscad()¶ Generates ROI as solid python object.
Useful if ROI is used to be passed to openscad.
Note
Will grab extent of geometry to find bounds in z-direction.
Returns: Solid python object. Return type: solid.solidpython.cylinder
-
getCenter()¶ Returns current center of ROI.
Returns: Current center. Return type: list
-
getCenterOfMass()¶ Returns center of mass of ROI.
For a radial ROI, this is equivalent to the
center.
-
getRadius()¶ Returns current radius of ROI.
Returns: Current radius. Return type: float
-
makeReducable(auto=False, debug=False)
-
setCenter(c)¶ Sets radius of ROI.
Parameters: c (list) – New center. Returns: New center. Return type: list
-
setRadius(r)¶ Sets radius of ROI.
Parameters: r (float) – New radius Returns: New radius. Return type: float
-
showBoundary(color=None, linewidth=3, ax=None)¶ Shows ROI in a 2D plot.
If no color is specified, will use color specified in
ROI.color.Keyword Arguments: - ax (matplotlib.axes) – Matplotlib axes used for plotting. If not specified, will generate new one.
- color (str) – Color of plot.
- linewidth (float) – Linewidth of plot.
Returns: Axes used for plotting.
Return type: matplotlib.axes
-
class
pyfrp.subclasses.pyfrp_ROI.radialSliceROI(embryo, name, Id, center, radius, height, width, sliceBottom, color='b')¶ Bases:
pyfrp.subclasses.pyfrp_ROI.sliceROI,pyfrp.subclasses.pyfrp_ROI.radialROI-
checkXYInside(x, y)¶ Checks if coordinates are inside ROI.
See also
pyfrp.modules.pyfrp_idx_module.checkInsideCircle().Parameters: - x (np.ndarray) – Array of x-coordinates.
- y (np.ndarray) – Array of y-coordinates.
Returns: Array of booleans with corresponding to [x,y].
Return type: np.ndarray
-
computeImgIdx(debug=False)¶ Computes image indices of ROI.
See also
pyfrp.modules.pyfrp_idx_module.getCircleIdxImg().Keyword Arguments: debug (bool) – Print debugging messages. Returns: Tuple containing: - imgIdxX (list): Image indices in x-direction.
- imgIdxY (list): Image indices in y-direction.
Return type: tuple
-
computeMeshIdx(mesh)¶ Computes mesh indices of ROI.
See also
pyfrp.modules.pyfrp_idx_module.getCircleIdxMesh().Parameters: mesh (fipy.GmshImporter3D) – Fipy mesh object. Returns: Newly computed mesh indices. Return type: list
-
computeXYExtend()¶ Computes extend of ROI in x/y direction.
Returns: Tuple containing: - xExtend (list): List containing minimum/maximum x-coordinate (
[xmin,xmax]). - yExtend (list): List containing minimum/maximum y-coordinate (
[ymin,ymax]).
Return type: tuple - xExtend (list): List containing minimum/maximum x-coordinate (
-
genAsOpenscad(allowInf=False)¶ Generates ROI as solid python object.
Useful if ROI is used to be passed to openscad.
Keyword Arguments: allowInf (bool) – Allow infinity in bounds of z-direction. Returns: Solid python object. Return type: solid.solidpython.cylinder
-
genGmshDomain(volSizePx=20.0, genLoops=True, genSurfaces=True, genVol=True, minID=None)¶ Translates ROI into gmsh domain object.
This object can then be used to write ROIs to
.geofiles.See also
pyfrp.modules.pyfrp_gmsh_geometry.domain.addCuboidByParameters().Note
If
minID==None, will grab maximum ID viapyfrp.subclasses.pyfrp_geometry.geometry.getMaxGeoID()and add 1.Keyword Arguments: - volSizePx (float) – Mesh size of vertices.
- genLoops (bool) – Generate line loops.
- genSurfaces (bool) – Generate surfaces.
- genVol (bool) – Generate surface loop and corresponding volume.
- minID (int) – Id at which geo IDs should start.
Returns: Domain object.
Return type:
-
writeToGeoFile(fn=None, volSizePx=20.0, genLoops=True, genSurfaces=True, genVol=True, minID=None)¶ Writes ROI to geo file.
Note
If
fnis not given, will save .geo file of ROI in same folder as the geometry file of the embryo with the following path:path/to/embryos/geo/file/nameOfEmbryo_nameOfROI.geo.See also
pyfrp.subclasses.pyfrp_ROI.polySliceROI.genGmshDomain().Keyword Arguments: - volSizePx (float) – Mesh size of vertices.
- genLoops (bool) – Generate line loops.
- genSurfaces (bool) – Generate surfaces.
- genVol (bool) – Generate surface loop and corresponding volume.
- minID (int) – Id at which geo IDs should start.
Returns: Path to geo file.
Return type: str
-
-
class
pyfrp.subclasses.pyfrp_ROI.rectangleROI(embryo, name, Id, offset, sidelengthX, sidelengthY, color='b')¶ Bases:
pyfrp.subclasses.pyfrp_ROI.ROI-
centerOffset()
-
checkXYInside(x, y)¶ Checks if coordinates are inside ROI.
See also
pyfrp.modules.pyfrp_idx_module.checkInsideRectangle().Parameters: - x (np.ndarray) – Array of x-coordinates.
- y (np.ndarray) – Array of y-coordinates.
Returns: Array of booleans with corresponding to [x,y].
Return type: np.ndarray
-
computeImgIdx(debug=False)¶ Computes image indices of ROI.
See also
pyfrp.modules.pyfrp_idx_module.getRectangleIdxImg().Keyword Arguments: debug (bool) – Print debugging messages. Returns: Tuple containing: - imgIdxX (list): Image indices in x-direction.
- imgIdxY (list): Image indices in y-direction.
Return type: tuple
-
computeMeshIdx(mesh)¶ Computes mesh indices of ROI.
See also
pyfrp.modules.pyfrp_idx_module.getRectangleIdxMesh().Parameters: mesh (fipy.GmshImporter3D) – Fipy mesh object. Returns: Newly computed mesh indices. Return type: list
-
computeXYExtend()¶ Computes extend of ROI in x/y direction.
Returns: Tuple containing: - xExtend (list): List containing minimum/maximum x-coordinate (
[xmin,xmax]). - yExtend (list): List containing minimum/maximum y-coordinate (
[ymin,ymax]).
Return type: tuple - xExtend (list): List containing minimum/maximum x-coordinate (
-
genAsOpenscad()¶ Generates ROI as solid python object.
Useful if ROI is used to be passed to openscad.
Note
Will grab extent of geometry to find bounds in z-direction.
Returns: Solid python object. Return type: solid.solidpython.cube
-
getCenterOfMass()¶ Computes center of mass of ROI.
The center of mass is computed by
\[c = \frac{1}{N} \sum\limits_{i=1}{N} x_i ,\]where \(c\) is the center of mass, \(N\) the number of corners and \(x_i\) is the coordinate of corner \(i\) .
Returns: Center of mass. Return type: numpy.ndarray
-
getCorners()¶ Returns corners of rectangle in counter-clockwise order, starting with offset.
Returns: List of 2D coordinates of corners. Return type: list
-
getOffset()
-
getSideLengthX()
-
getSideLengthY()
-
makeReducable(atuo=False, debug=False)
-
setOffset(c)
-
setSideLengthX(s)
-
setSideLengthY(s)
-
showBoundary(color=None, linewidth=3, ax=None)¶ Shows ROI in a 2D plot.
If no color is specified, will use color specified in
ROI.color.Keyword Arguments: - ax (matplotlib.axes) – Matplotlib axes used for plotting. If not specified, will generate new one.
- color (str) – Color of plot.
- linewidth (float) – Linewidth of plot.
Returns: Axes used for plotting.
Return type: matplotlib.axes
-
-
class
pyfrp.subclasses.pyfrp_ROI.rectangleSliceROI(embryo, name, Id, offset, sidelengthX, sidelengthY, height, width, sliceBottom, color='b')¶ Bases:
pyfrp.subclasses.pyfrp_ROI.rectangleROI,pyfrp.subclasses.pyfrp_ROI.sliceROI-
checkXYInside(x, y)¶ Checks if coordinates are inside ROI.
See also
pyfrp.modules.pyfrp_idx_module.checkInsideRectangle().Parameters: - x (np.ndarray) – Array of x-coordinates.
- y (np.ndarray) – Array of y-coordinates.
Returns: Array of booleans with corresponding to [x,y].
Return type: np.ndarray
-
computeImgIdx(debug=False)¶ Computes image indices of ROI.
See also
pyfrp.modules.pyfrp_idx_module.getRectangleIdxImg().Keyword Arguments: debug (bool) – Print debugging messages. Returns: Tuple containing: - imgIdxX (list): Image indices in x-direction.
- imgIdxY (list): Image indices in y-direction.
Return type: tuple
-
computeMeshIdx(mesh)¶ Computes mesh indices of ROI.
See also
pyfrp.modules.pyfrp_idx_module.getRectangleIdxMesh().Parameters: mesh (fipy.GmshImporter3D) – Fipy mesh object. Returns: Newly computed mesh indices. Return type: list
-
computeXYExtend()¶ Computes extend of ROI in x/y direction.
Returns: Tuple containing: - xExtend (list): List containing minimum/maximum x-coordinate (
[xmin,xmax]). - yExtend (list): List containing minimum/maximum y-coordinate (
[ymin,ymax]).
Return type: tuple - xExtend (list): List containing minimum/maximum x-coordinate (
-
genAsOpenscad()¶ Generates ROI as solid python object.
Useful if ROI is used to be passed to openscad.
Returns: Solid python object. Return type: solid.solidpython.cube
-
genGmshDomain(volSizePx=20.0, genLoops=True, genSurfaces=True, genVol=True, minID=None)¶ Translates ROI into gmsh domain object.
This object can then be used to write ROIs to
.geofiles.See also
pyfrp.modules.pyfrp_gmsh_geometry.domain.addCuboidByParameters().Note
If
minID==None, will grab maximum ID viapyfrp.subclasses.pyfrp_geometry.geometry.getMaxGeoID()and add 1.Keyword Arguments: - volSizePx (float) – Mesh size of vertices.
- genLoops (bool) – Generate line loops.
- genSurfaces (bool) – Generate surfaces.
- genVol (bool) – Generate surface loop and corresponding volume.
- minID (int) – Id at which geo IDs should start.
Returns: Domain object.
Return type:
-
writeToGeoFile(fn=None, volSizePx=20.0, genLoops=True, genSurfaces=True, genVol=True, minID=None)¶ Writes ROI to geo file.
Note
If
fnis not given, will save .geo file of ROI in same folder as the geometry file of the embryo with the following path:path/to/embryos/geo/file/nameOfEmbryo_nameOfROI.geo.See also
pyfrp.subclasses.pyfrp_ROI.polySliceROI.genGmshDomain().Keyword Arguments: - volSizePx (float) – Mesh size of vertices.
- genLoops (bool) – Generate line loops.
- genSurfaces (bool) – Generate surfaces.
- genVol (bool) – Generate surface loop and corresponding volume.
- minID (int) – Id at which geo IDs should start.
Returns: Path to geo file.
Return type: str
-
-
class
pyfrp.subclasses.pyfrp_ROI.sliceROI(embryo, name, Id, height, width, sliceBottom, color='b')¶ Bases:
pyfrp.subclasses.pyfrp_ROI.ROI-
checkXYInside(x, y)¶ Checks if coordinates are inside ROI.
Only returns
True, sincesliceROIis not limited in x/y-direction.Parameters: - x (np.ndarray) – Array of x-coordinates.
- y (np.ndarray) – Array of y-coordinates.
Returns: Array of booleans with corresponding to [x,y], all
True.Return type: np.ndarray
-
computeImgIdx(debug=False)¶ Computes image indices of ROI.
See also
pyfrp.modules.pyfrp_idx_module.getAllIdxImg().Keyword Arguments: debug (bool) – Print debugging messages. Returns: Tuple containing: - imgIdxX (list): Image indices in x-direction.
- imgIdxY (list): Image indices in y-direction.
Return type: tuple
-
computeMeshIdx(mesh)¶ Computes mesh indices of ROI.
See also
pyfrp.modules.pyfrp_idx_module.getSliceIdxMesh().Parameters: mesh (fipy.GmshImporter3D) – Fipy mesh object. Returns: Newly computed mesh indices. Return type: list
-
computeXYExtend()¶ Computes extend of ROI in x/y direction.
Note
Since sliceROI theoretically is not having any limits in x/y-direction, function returns limits given by input image, that is,
[0,embryo.dataResPx].Returns: Tuple containing: - xExtend (list): List containing minimum/maximum x-coordinate (
[xmin,xmax]). - yExtend (list): List containing minimum/maximum y-coordinate (
[ymin,ymax]).
Return type: tuple - xExtend (list): List containing minimum/maximum x-coordinate (
-
computeZExtend()
-
genAsOpenscad()¶ Generates ROI as solid python object.
Useful if ROI is used to be passed to openscad.
Note
Will grab extent of geometry to find bounds in x/y-direction.
Returns: Solid python object. Return type: solid.solidpython.cube
-
getHeight()
-
getSliceBottom()
-
getWidth()
-
setHeight(h)
-
setSliceBottom(s)
-
setWidth(w)
-
-
class
pyfrp.subclasses.pyfrp_ROI.squareROI(embryo, name, Id, offset, sidelength, color='b')¶ Bases:
pyfrp.subclasses.pyfrp_ROI.ROI-
centerOffset()
-
checkXYInside(x, y)¶ Checks if coordinates are inside ROI.
See also
pyfrp.modules.pyfrp_idx_module.checkInsideSquare().Parameters: - x (np.ndarray) – Array of x-coordinates.
- y (np.ndarray) – Array of y-coordinates.
Returns: Array of booleans with corresponding to [x,y].
Return type: np.ndarray
-
computeImgIdx(debug=False)¶ Computes image indices of ROI.
See also
pyfrp.modules.pyfrp_idx_module.getSquareIdxImg().Keyword Arguments: debug (bool) – Print debugging messages. Returns: Tuple containing: - imgIdxX (list): Image indices in x-direction.
- imgIdxY (list): Image indices in y-direction.
Return type: tuple
-
computeMeshIdx(mesh)¶ Computes mesh indices of ROI.
See also
pyfrp.modules.pyfrp_idx_module.getSquareIdxMesh().Parameters: mesh (fipy.GmshImporter3D) – Fipy mesh object. Returns: Newly computed mesh indices. Return type: list
-
computeXYExtend()¶ Computes extend of ROI in x/y direction.
Returns: Tuple containing: - xExtend (list): List containing minimum/maximum x-coordinate (
[xmin,xmax]). - yExtend (list): List containing minimum/maximum y-coordinate (
[ymin,ymax]).
Return type: tuple - xExtend (list): List containing minimum/maximum x-coordinate (
-
genAsOpenscad()¶ Generates ROI as solid python object.
Useful if ROI is used to be passed to openscad.
Note
Will grab extent of geometry to find bounds in z-direction.
Returns: Solid python object. Return type: solid.solidpython.cube
-
getCenterOfMass()¶ Computes center of mass of ROI.
The center of mass is computed by
\[c = \frac{1}{N} \sum\limits_{i=1}{N} x_i ,\]where \(c\) is the center of mass, \(N\) the number of corners and \(x_i\) is the coordinate of corner \(i\) .
Returns: Center of mass. Return type: numpy.ndarray
-
getCorners()¶ Returns corners of square in counter-clockwise order, starting with offset.
Returns: List of 2D coordinates of corners. Return type: list
-
getOffset()
-
getSideLength()
-
makeReducable(auto=False, debug=False)
-
setOffset(c)
-
setSideLength(s)
-
showBoundary(color=None, linewidth=3, ax=None)¶ Shows ROI in a 2D plot.
If no color is specified, will use color specified in
ROI.color.Keyword Arguments: - ax (matplotlib.axes) – Matplotlib axes used for plotting. If not specified, will generate new one.
- color (str) – Color of plot.
- linewidth (float) – Linewidth of plot.
Returns: Axes used for plotting.
Return type: matplotlib.axes
-
-
class
pyfrp.subclasses.pyfrp_ROI.squareSliceROI(embryo, name, Id, offset, sidelength, height, width, sliceBottom, color='b')¶ Bases:
pyfrp.subclasses.pyfrp_ROI.squareROI,pyfrp.subclasses.pyfrp_ROI.sliceROI-
checkXYInside(x, y)¶ Checks if coordinates are inside ROI.
See also
pyfrp.modules.pyfrp_idx_module.checkInsideSquare().Parameters: - x (np.ndarray) – Array of x-coordinates.
- y (np.ndarray) – Array of y-coordinates.
Returns: Array of booleans with corresponding to [x,y].
Return type: np.ndarray
-
computeImgIdx(debug=False)¶ Computes image indices of ROI.
See also
pyfrp.modules.pyfrp_idx_module.getSquareIdxImg().Keyword Arguments: debug (bool) – Print debugging messages. Returns: Tuple containing: - imgIdxX (list): Image indices in x-direction.
- imgIdxY (list): Image indices in y-direction.
Return type: tuple
-
computeMeshIdx(mesh)¶ Computes mesh indices of ROI.
See also
pyfrp.modules.pyfrp_idx_module.getSquareIdxMesh().Parameters: mesh (fipy.GmshImporter3D) – Fipy mesh object. Returns: Newly computed mesh indices. Return type: list
-
computeXYExtend()¶ Computes extend of ROI in x/y direction.
Returns: Tuple containing: - xExtend (list): List containing minimum/maximum x-coordinate (
[xmin,xmax]). - yExtend (list): List containing minimum/maximum y-coordinate (
[ymin,ymax]).
Return type: tuple - xExtend (list): List containing minimum/maximum x-coordinate (
-
genAsOpenscad()¶ Generates ROI as solid python object.
Useful if ROI is used to be passed to openscad.
Returns: Solid python object. Return type: solid.solidpython.cube
-
genGmshDomain(volSizePx=20.0, genLoops=True, genSurfaces=True, genVol=True, minID=None)¶ Translates ROI into gmsh domain object.
This object can then be used to write ROIs to
.geofiles.See also
pyfrp.modules.pyfrp_gmsh_geometry.domain.addCuboidByParameters().Note
If
minID==None, will grab maximum ID viapyfrp.subclasses.pyfrp_geometry.geometry.getMaxGeoID()and add 1.Keyword Arguments: - volSizePx (float) – Mesh size of vertices.
- genLoops (bool) – Generate line loops.
- genSurfaces (bool) – Generate surfaces.
- genVol (bool) – Generate surface loop and corresponding volume.
Returns: Domain object.
Return type:
-
writeToGeoFile(fn=None, volSizePx=20.0, genLoops=True, genSurfaces=True, genVol=True, minID=None)¶ Writes ROI to geo file.
Note
If
fnis not given, will save .geo file of ROI in same folder as the geometry file of the embryo with the following path:path/to/embryos/geo/file/nameOfEmbryo_nameOfROI.geo.See also
pyfrp.subclasses.pyfrp_ROI.polySliceROI.genGmshDomain().Keyword Arguments: - volSizePx (float) – Mesh size of vertices.
- genLoops (bool) – Generate line loops.
- genSurfaces (bool) – Generate surfaces.
- genVol (bool) – Generate surface loop and corresponding volume.
- minID (int) – Id at which geo IDs should start.
Returns: Path to geo file.
Return type: str
-
pyfrp.subclasses.pyfrp_analysis module
Essential PyFRAP module containing analysis class.
-
class
pyfrp.subclasses.pyfrp_analysis.analysis(embryo)¶ PyFRAP analysis class storing information about analysis options and some analysis results.
Analysis options are:
gaussian: Apply gaussian filter to images. Default kernel size isgaussianSigma=2.median: Apply gaussian filter to images. Default kernel size ismedianRadius=5.flatten: Apply flattening mask.norm: Norm by pre image.bkgd: Substract background.quad: Perform reduction to first quadrant by flipping.flipBeforeProcess: Flip into quadrant before other processing options are applied.
Analysis options are stored in
processdictionary. If analysis finds option inprocess.keys, it will perform option. Analysis options can be turned on/off using the respective functions, such aspyfrp.subclasses.pyfrp_analysis.medianOn()pyfrp.subclasses.pyfrp_analysis.flattenOn()- etc.
Processing parameters are stored in
process.values.The default processing options are
process={}, meaning that no image modification is applied before concentration readout, see alsogenDefaultProcess().Warning
Quadrant reduction is still experimental.
Three other important attributes are:
dataOffset: The offset of the data that is for example used for norming, see alsogetOptimalOffset().addRimImg: Flag that controls if rim concentrations are added to ROI concentratrtion profiles, see alsosetAddRimImg().concRim: The rim concentration of the first post-bleaching image used later by the simulation for nodes that are outside of original image boundaries.
Note
addRimImg=Trueby default. This is generally good, since the simulation value in ROIs is getting evaluated over over mesh nodes both inside the actual image and outside of it.Parameters: embryo (pyfrp.subclasses.pyfrp_embryo.embryo) – PyFRAP embryo instance. -
bkgdOn()¶ Returns current state of this option.
Returns: Trueif switched on,Falseelse.Return type: bool
-
computeBkgdMask(flatteningMask, applyProcess=True, applyFlatten=False)¶ Computes background mask.
Takes first
nBkgdimages infnBkgdand computes mean image of these images. Then, ifapplyProcessis selected, applies the selected process options defined inprocessdictionary to it.Note
Will not apply process options
normandbkgdto mean background image.Parameters: flatteningMask (numpy.ndarray) – Flattening mask.
Keyword Arguments: - applyProcess (bool) – Apply processing options to background mask.
- applyFlatten (bool) – Apply flattening to background mask.
Returns: Background mask.
Return type: numpy.ndarray
-
computeFlatteningMask(applyProcess=True)¶ Computes flattening mask.
Takes first
nFlattenimages infnFlattenand computes mean image of these images. Then, ifapplyProcessis selected, applies the selected process options defined inprocessdictionary to it.Note
Will not apply process options
norm,flattenandbkgdto mean flattening image.Keyword Arguments: applyProcess (bool) – Apply processing options to flattening mask. Returns: Flattening mask. Return type: numpy.ndarray
-
computePreMask(flatteningMask, bkgdMask, applyProcess=True)¶ Computes norming mask.
Takes first
nPreimages infnPreimageand computes mean image of these images. Then, ifapplyProcessis selected, applies the selected process options defined inprocessdictionary to it.Note
Will not apply process option
normto mean background image.Parameters: - flatteningMask (numpy.ndarray) – Flattening mask.
- bkgdMask (numpy.ndarray) – Background mask.
Keyword Arguments: applyProcess (bool) – Apply processing options to background mask.
Returns: Norming mask.
Return type: numpy.ndarray
-
flattenOn()¶ Returns current state of this option.
Returns: Trueif switched on,Falseelse.Return type: bool
-
flipBeforeProcessOn()¶ Returns current state of this option.
Returns: Trueif switched on,Falseelse.Return type: bool
-
gaussianOn()¶ Returns current state of this option.
Returns: Trueif switched on,Falseelse.Return type: bool
-
genDefaultProcess()¶ Sets
processdictionary to default options.Default options are:
gaussian=Falsemedian=Falsequad=Falseflatten=Falsebkgd=Falsenorm=FalseflipBeforeProcess=True
Returns: Updated processdictionary.Return type: dict
-
getAddRimImg()¶ Returns the addRimImg flag.
See also
setAddRimImg().Returns: Flag value. Return type: bool
-
getConcRim()¶ Returns rim concentration.
Returns: Current rim concentration. Return type: float
-
getDataOffset()¶ Returns dataoffset used for norming.
Returns: Current offset. Return type: float
-
getFnBkgd()¶ Returns path to background dataset.
Returns: Path to background dataset. Return type: str
-
getFnFlatten()¶ Returns path to flattening dataset.
Returns: Path to flattening dataset. Return type: str
-
getFnPre()¶ Returns path to norming dataset.
Returns: Path to norming dataset. Return type: str
-
getGaussianSigma()¶ Returns size of gaussian kernel.
See also http://scikit-image.org/docs/dev/api/skimage.filters.html#skimage.filters.gaussian_filter.
Returns: Gaussian sigma. Return type: float
-
getMedianRadius()¶ Returns size of median kernel.
See also http://scikit-image.org/docs/dev/api/skimage.filters.html#skimage.filters.median and http://docs.scipy.org/doc/scipy-0.15.1/reference/generated/scipy.ndimage.filters.median_filter.html.
Returns: New radius. Return type: float
-
getNBkgd()¶ Returns the number of images used for the computation for the mean background image.
Returns: Number of images used. Return type: int
-
getNFlatten()¶ Returns the number of images used for the computation for the mean flattening image.
Returns: Number of images used. Return type: int
-
getNPre()¶ Returns the number of images used for the computation for the mean norming image.
Returns: Number of images used. Return type: int
-
getOptimalOffset(debug=False)¶ Computes optimal dataoffset for data analysis.
Finds minimal non-zero offset for main dataset, preimage dataset flattening dataset and background dataset, if available. The Idea is that one does not want to have negative pixels, so substraction of a fixed value from an image should always lead to positive pixel values. Thus the offset is computed by
\[offset = max\{ o_{\mathrm{min},\mathrm{data}},o_{\mathrm{min},\mathrm{flatten}} ,o_{\mathrm{min},\mathrm{pre}},o_{\mathrm{min},\mathrm{bkgd}}\}\]where \(o_{\mathrm{min},d}\) is the minimum pixel values of all images in dataset \(d\).
Keyword Arguments: debug (bool) – Print debugging messages. Returns: Optimal offset. Return type: float
-
getProcess()¶ Returns process dictionary.
-
medianOn()¶ Returns current state of this option.
Returns: Trueif switched on,Falseelse.Return type: bool
-
normOn()¶ Returns current state of this option.
Returns: Trueif switched on,Falseelse.Return type: bool
-
parm2Process(b, key, val)¶ Adds/Removes a new option to
processdictionary.Parameters: - b (bool) – Flag if process should be added or removed.
- key (str) – Key of option to be added.
- val (any) – Value of dictionary entry.
Returns: Updated
processdictionary.Return type: dict
-
printAllAttr()¶ Prints out all attributes of analysis object.
-
printProcess()¶ Prints out current process options in a nicely formatted way.
-
quadOn()¶ Returns current state of this option.
Returns: Trueif switched on,Falseelse.Return type: bool
-
removeProcessStep(dic, step)¶ Removes process step from dictionary.
Parameters: - dic (dict) – A dictionary.
- step (str) – Key of step to be removed.
Returns: Updated dictionary.
Return type: dict
-
run(signal=None, embCount=None, debug=False, debugAll=False, showProgress=True)¶ Runs analysis by passing analysis object to
pyfrp.modules.pyfrp_img_module.analyzeDataset().Will first check if ROI indices are computed for all ROIs and if necessary compute them before starting data analysis.
Keyword Arguments: - signal (PyQt4.QtCore.pyqtSignal) – PyQT signal to send progress to GUI.
- embCount (int) – Counter of counter process if multiple datasets are analyzed.
- debug (bool) – Print final debugging messages and show debugging plots.
- debugAll (bool) – Print debugging messages and show debugging plots of each step.
- showProgress (bool) – Print out progress.
Returns: Updated analysis instance.
Return type:
-
setAddRimImg(s)¶ Sets the addRimImg flag.
The addRim flag controls if the rim concentration is added to the concentration of each ROI timeseries depending on how many imaginary pixels they have outside of the actual image.
Parameters: s (bool) – Flag value.
-
setBkgd(b)¶ Turns on/off background substraction for analysis.
Note
Will use
bkgdMaskfor flattening.bkgdMaskis updated viacomputeBkgdMask()and then automatically updated inprocessdictionary.Parameters: b (bool) – Trueif background substraction should be turned on,Falseelse.Returns: Updated process dictionary. Return type: dict
-
setConcRim(s)¶ Sets rim concentration.
Parameters: s (float) – New rim concentration.
-
setDataOffset(s)¶ Sets dataoffset used for norming.
Parameters: s (float) – New offset.
-
setFlatten(b)¶ Turns on/off flattening for analysis.
Note
Will use
flatteningMaskfor flattening.flatteningMaskis updated viacomputeFlatteningMask()and then automatically updated inprocessdictionary.Parameters: b (bool) – Trueif flattening should be turned on,Falseelse.Returns: Updated process dictionary. Return type: dict
-
setFlipBeforeProcess(b)¶ Turns on/off if image should be flipped into quadrant before or after performing all other image processing for analysis.
Warning
Quadrant reduction is still experimental.
Parameters: b (bool) – Trueif image should be flipped before,Falseelse.Returns: Updated process dictionary. Return type: dict
-
setFnBkgd(fn)¶ Sets path to background dataset.
Parameters: fn (str) – Path to background dataset.
-
setFnFlatten(fn)¶ Sets path to flattening dataset.
Parameters: fn (str) – Path to flattening dataset.
-
setFnPre(fn)¶ Sets path to preimage dataset.
Parameters: fn (str) – Path to preimage dataset.
-
setGaussian(b)¶ Turns on/off gaussian filter for analysis.
Note
Will use
gaussianSigmaas kernel size. Can be changed viasetGaussianSigma().Parameters: b (bool) – Trueif gaussian should be turned on,Falseelse.Returns: Updated process dictionary. Return type: dict
-
setGaussianSigma(s)¶ Sets size of gaussian kernel and updates its value in
processdictionary if gaussian filter is turned on.See also http://scikit-image.org/docs/dev/api/skimage.filters.html#skimage.filters.gaussian_filter.
Parameters: s (float) – New sigma.
-
setMedian(b)¶ Turns on/off median filter for analysis.
Note
Will use
medianRadiusas kernel size. Can be changed viasetMedianRadius().Parameters: b (bool) – Trueif median should be turned on,Falseelse.Returns: Updated process dictionary. Return type: dict
-
setMedianRadius(s)¶ Sets size of median kernel and updates its value in
processdictionary if median filter is turned on.See also http://scikit-image.org/docs/dev/api/skimage.filters.html#skimage.filters.median and http://docs.scipy.org/doc/scipy-0.15.1/reference/generated/scipy.ndimage.filters.median_filter.html.
Parameters: s (float) – New radius.
-
setNBkgd(n)¶ Sets the number of images used for the computation for the mean background image.
Parameters: n (int) – Number of images used.
-
setNFlatten(n)¶ Sets the number of images used for the computation for the mean flattening image.
Parameters: n (int) – Number of images used.
-
setNPre(n)¶ Sets the number of images used for the computation for the mean norming image.
Parameters: n (int) – Number of images used.
-
setNorm(b)¶ Turns on/off norming by preimage for analysis.
Note
Will use
preMaskfor norming.preMaskis updated viacomputePreMask()and then automatically updated inprocessdictionary.Parameters: b (bool) – Trueif norming should be turned on,Falseelse.Returns: Updated process dictionary. Return type: dict
-
setProcess(s)¶ Sets process dictionary.
Parameters: s (dict) – New process dictionary.
-
setQuad(b)¶ Turns on/off if image should be flipped into first quadrant for analysis.
Warning
Quadrant reduction is still experimental.
Parameters: b (bool) – Trueif quadrant reduction should be turned on,Falseelse.Returns: Updated process dictionary. Return type: dict
-
updateProcess()¶ Updates all values in process dictionary with the ones saved in attributes of analysis object.
pyfrp.subclasses.pyfrp_conf module
-
class
pyfrp.subclasses.pyfrp_conf.configuration¶ -
addRecentFile(fn)
-
backupPathFile()
-
copyPathFileToDefaultLocation()
-
getBackup2File(h)
-
getBackup2Memory(h)
-
getPathFile()
-
getPlotHidden(h)
-
getPropHidden(h)
-
getRecentFiles(r)
-
getTermHidden(h)
-
printConfiguration()
-
save(fn=None)
-
setBackup2File(h)
-
setBackup2Memory(h)
-
setPathFile(fn)
-
setPlotHidden(h)
-
setPropHidden(h)
-
setRecentFiles(r)
-
setTermHidden(h)
-
updateVersion()
-
pyfrp.subclasses.pyfrp_embryo module
Essential PyFRAP module containing embryo class.
-
class
pyfrp.subclasses.pyfrp_embryo.embryo(name)¶ Main PyFRAP class, gathering all the data and parameters of FRAP experiment.
The
embryoclass basically stores:- A minimum set of basic FRAP parameters.
- A list of
pyfrp.subclasses.pyfrp_ROI.ROIclasses, describing all ROIs used for for evaluating simulation and analysis results. - A
pyfrp.subclasses.pyfrp_geometry.geometryclass describing the 3-dimensional geometry of the experiment. - A
pyfrp.subclasses.pyfrp_analysis.analysisclass describing how the dataset is going to be analyzed. - A
pyfrp.subclasses.pyfrp_simulation.simulationclass describing how the dataset is going to be simulated. - A list of
pyfrp.subclasses.pyfrp_fit.fitclasses, storing different fitting options and results.
The
embryoclass comes with a comprehensive set of methods aimed at making it as powerful as possible, while still keeping it simple. The hierarchical structure should make it easy to navigate through a FRAP dataset.-
ROIs2Full()¶ Sets ROIs to full mode.
Returns: Updated list of ROIs. Return type: list
-
ROIs2Quad()¶ Reduces ROIs to quadrant reduced mode, mapping all their indices in first quadrant.
Note
Use :py:func:setEmbryo2Quad to make sure that both geometry and ROIs are reduced.
Warning
Quadrant reduction is still experimental.
Returns: Updated list of ROIs. Return type: list
-
addFit(fit)¶ Appends fit object to list of fits
Parameters: fit (pyfrp.subclasses.pyfrp_fit.fit) – fit object. Returns: Updated fitslist.Return type: list
-
addROI(roi)¶ Adds ROI to
ROIslist.Parameters: roi (pyfrp.subclasses.pyfrp_ROI.ROI) – A PyFRAP ROI. Returns: Updated ROIs list. Return type: list
-
checkQuadReducable(tryFix=False, auto=False, debug=False)¶ Checks if embryo is reducable to quadrant by checking if all ROIs are either point or axis symmetric around geometry center.
Note
You want to call :py:meth:showAllROIBoundaries and :py:meth:computeROIIdxs afterwards to make sure everything went properly.
Warning
Quadrant reduction is still experimental.
Keyword Arguments: - tryFix (bool) – Tries to readjust ROIs into reducable form.
- auto (bool) – Readjust ROIs automatically.
- debug (bool) – Print debugging messages.
Returns: True if embryo is reducable.
Return type: bool
-
checkROIIdxs(debug=False)¶ Checks if all ROIs have their mesh and image indices computed.
Keyword Arguments: debug (bool) – Print debugging messages. Returns: Tuple containing: - img (bool): True if all ROIs have up-to-date image indices.
- mesh (bool): True if all ROIs have up-to-date mesh indices.
Return type: tuple
-
clearAllAttributes()¶ Replaces all attribute values of embryo object with
None, exceptname.Useful if embryos are seperated and molecule file needs to be compressed.
Returns: True if success, False else. Return type: bool
-
compareFitsByAIC(ROIs=None, sigma=1, fromSSD=True, thresh=None, printOut=True)¶ Compares all fits of embryo using the Akaike information criterion (AIC).
For a detailed explanation of the model selection procedure, please refer to
pyfrp.modules.pyfrp_stats_module.compareFitsByAIC().If
printOutis selected, will print a list of selected fits and the underlying Akaike values in a readable table.If the AIC or the AICc should be used can be determined using
pyfrp.modules.pyfrp_stats_module.useAIC().Keyword Arguments: - ROIs (list) – List of ROIs to be considered for computation.
- sigma (float) – Standard deviation of normal distribution if known.
- fromSSD (bool) – Simply use SSD as maximum likelihood.
- thresh (float) – Probability range for model selection.
Returns: Tuple containing:
- AICs (list): List of AIC values of the respective fits.
- deltaAICs (numpy.ndarray): List of Akaike difference values of the respective fits.
- weights (numpy.ndarray): List of Akaike difference weights of the respective fits.
- acc (list): List of acceptable fits by model selection.
- ks (list): List of number of parameters fitted of the respective fits.
- ns (list): List of number of datapoints fitted of the respective fits.
Return type: tuple
-
compareFitsByCorrAIC(ROIs=None, sigma=1, fromSSD=True, thresh=None, printOut=True)¶ Compares all fits of embryo using the corrected Akaike information criterion (AICc).
For a detailed explanation of the model selection procedure, please refer to
pyfrp.modules.pyfrp_stats_module.compareFitsByCorrAIC().If
printOutis selected, will print a list of selected fits and the underlying Akaike values in a readable table.If the AIC or the AICc should be used can be determined using
pyfrp.modules.pyfrp_stats_module.useAIC().Keyword Arguments: - ROIs (list) – List of ROIs to be considered for computation.
- sigma (float) – Standard deviation of normal distribution if known.
- fromSSD (bool) – Simply use SSD as maximum likelihood.
- thresh (float) – Probability range for model selection.
Returns: Tuple containing:
- AICs (list): List of AICc values of the respective fits.
- deltaAICs (numpy.ndarray): List of Akaike difference values of the respective fits.
- weights (numpy.ndarray): List of Akaike difference weights of the respective fits.
- acc (list): List of acceptable fits by model selection.
- ks (list): List of number of parameters fitted of the respective fits.
- ns (list): List of number of datapoints fitted of the respective fits.
Return type: tuple
-
computeBkgd(useMin=False, fromTS='both', debug=False)¶ Computes background value over all ROIs.
If
useMin==False, will use value at first index of data/simulation vectors as norming value.Note
Use
fromTS='both'to use values from both simulation and data for background computation. IffromTS='data', will only use data, offromTS='sim'will only use simulation vectors.Keyword Arguments: - useMin (bool) – Use minimum value for background computation.
- fromTS (bool) – Which time series to use for background computation.
- debug (bool) – Print debugging messages.
Returns: Background value.
Return type: float
-
computeConvFact(updateDim=True)¶ Computes conversion factor between um to px (unit=um/px).
If
updateDimensionsis selected, will update all dimensions of embryo object data rely onconvFact.Keyword Arguments: updateDim (bool) – Automatically updated all convFact relevant attributes. Returns: New conversion factor. Return type: float
-
computeIdealFRAPPinVals(bkgdName='Bleached Square', normName='Slice', debug=False, useMin=False, useMax=False, sepSim=True, switchThresh=0.95)¶ Computes background and norming value using optimized settings.
Idea: Instead using values from all ROIs to compute pinning values, select two ROIs that should lead to optimal pinning values. In the default case, this is the ROI describing the bleached region (here we expect the lowest intensities), and the slice (here we expect the overall end concentration the experiment is converging to).
If
useMin==False, will use value at first index of data/simulation vectors as norming value.If
useMax==False, will use value at last index of data/simulation vectors as norming value.Note
If
bkgdNameandnormNameare not set differently, will look for ROIs with these names for background and norming computation, respectively. If they don’t exist, will returnNone.genDefaultROIs()will make sure that both those ROIs exist.Warning
Not all ROIs are suitable for pinning value computation. Generally ROIs that have the least extended volume proof most suitable.
Note
switchThreshchecks if recovery is complete. This is important if recovery curves are very slow and bleached region does not reach full recovery. If this happens, we divide by a number that is smaller than 1 and hence boost all timeseries way above one instead of limiting it below oneWarning
sepSim==Truemakes sure that we never get negative intensities in the pinned simulation vectors. Since interpolation is never perfect, this can happen if \(bkgdValue(data)>bkgdValue(sim)\).Keyword Arguments: - bkgdName (str) – Name of ROI used for background computation.
- normName (str) – Name of ROI used for norming computation.
- useMin (bool) – Use minimum value for background computation.
- useMax (bool) – Use maximum value for norm value computation.
- fromTS (bool) – Which time series to use for background computation.
- debug (bool) – Print debugging messages.
- sepSim (bool) – Use seperate pinning values for simulation vectors.
Returns: Tuple containing:
- bkgdVal (float): Background value for data vectors.
- normVal (float): Norming value for data vectors.
- bkgdValSim (float): Background value for simulation vectors.
- normValSim (float): Norming value for simulation vectors.
Return type: tuple
-
computeNorm(bkgdVal, useMax=True, fromTS='both', debug=False)¶ Computes background value over all ROIs.
If
useMax==False, will use value at last index of data/simulation vectors as norming value.Note
Use
fromTS='both'to use values from both simulation and data for background computation. IffromTS='data', will only use data, offromTS='sim'will only use simulation vectors.Parameters: bkgdVal (float) – Use this background value instead of newly computing it.
Keyword Arguments: - useMax (bool) – Use maximum value for norm value computation.
- fromTS (bool) – Which time series to use for background computation.
- debug (bool) – Print debugging messages.
Returns: Norming value.
Return type: float
-
computePinVals(useMin=True, useMax=True, bkgdVal=None, debug=False)¶ Compute overall pinning values over all ROIs.
Keyword Arguments: - useMin (bool) – Use minimum value for background computation.
- useMax (bool) – Use maximum value for norm value computation.
- bkgdVal (float) – Use this background value instead of newly computing it.
- debug (bool) – Print debugging messages.
Returns: Tuple containing:
- bkgdVal (float): Background value.
- normVal (float): Norming value.
Return type: tuple
-
computeROIIdxs(signal=None, debug=True)¶ Computes image, extended and mesh indices of all ROIs in embryo’s
ROIslist.Keyword Arguments: - signal (PyQt4.QtCore.pyqtSignal) – PyQT signal to send progress to GUI.
- debug (bool) – Print final debugging messages and show debugging plots.
Returns: Updated list of ROIs.
Return type: list
-
copy()¶ Copies embryo, preserving all attributes and methods.
Returns: Embryo copy. Return type: pyfrp.subclasses.pyfrp_embryo.embryo
-
deleteFit(i)¶ Deletes fit with index
ifromfitslist.Parameters: i (int) – Index of fit to be deleted. Returns: Updated fitslist.Return type: list
-
fixFilePaths()¶ Fixes paths to geometry/meshfiles.
Returns: True if success for all paths. Return type: bool
-
genDefaultROIs(center, radius, rimFactor=0.66, masterROI=None, bleachedROI=None, rimROI=None, sliceHeightPx=None, clean=True)¶ Creates a standard set of ROI objects and adds them to
ROIslist.The set of ROIs covers the generally most useful ROIs used for FRAP experiments, providing already all the settings that PyFRAP uses for rim computation etc.
ROIs contain:
- All: ROI covering all pixels and mesh nodes.
pyfrp.subclasses.pyfrp_ROI.sliceROI - All Square: ROI covering all pixels and mesh nodes inside bleached region.
pyfrp.subclasses.pyfrp_ROI.squareROI - All Out: ROI covering all pixels and mesh nodes outside bleached region.
pyfrp.subclasses.pyfrp_ROI.customROI - Slice: ROI covering all pixels and mesh nodes inside recorded field of view.
pyfrp.subclasses.pyfrp_ROI.radialSliceROI - Slice rim: ROI covering all pixels that are not used for rim concentration computation.
pyfrp.subclasses.pyfrp_ROI.radialSliceROI - Rim: ROI covering all pixels that are used for rim concentration computation.
pyfrp.subclasses.pyfrp_ROI.customROI - Bleached Square: ROI covering all pixels and mesh nodes inside bleached region and imaging slice.
pyfrp.subclasses.pyfrp_ROI.squareSliceROI - Out: ROI covering all pixels and mesh nodes outside bleached region but inside imaging slice.
pyfrp.subclasses.pyfrp_ROI.customROI
Note
Will automatically set
SliceasmasterROI.Note
If
masterROIis given, will use this ROI instead of Slice as master ROI viasetMasterROIIdx(). Will not create Slice at all. IfmasterROIis not inROIslist yet, it will be automatically added to the list.Note
If
bleachedROIis given, will use this ROI instead of Bleached Square. Will generate copy ofbleachedROIto generate All Square type ROI.Note
If
rimROIis given, Slice rim is not created, andrimROIis used instead.Note
If
sliceHeightPxis given, will create ROIs Slice, Out, Bleached Square and Rim at this height, otherwise will use value stored inembryo.sliceHeightPx.Parameters: - center (list) – Center of circle defining imaging slice.
- radius (float) – Radius of circle defining imaging slice.
Keyword Arguments: - rimFactor (float) – Factor describing percentage of imaging slice excluded from rim computation.
- sliceHeightPx (float) – Height of slice ROI in px.
- clean (bool) – Will remove all ROIs from embryo object before creating new ones.
- masterROI (pyfrp.subclasses.pyfrp_ROI.ROI) – ROI that is supposed to be used as a masterROI.
- bleachedROI (pyfrp.subclasses.pyfrp_ROI.ROI) – ROI that is supposed to be used to indicate the bleached region.
- rimROI (pyfrp.subclasses.pyfrp_ROI.ROI) – ROI that is substracted from Slice. Should lie withing Slice.
Returns: Updated list of ROIs.
Return type: list
- All: ROI covering all pixels and mesh nodes.
-
geometry2Full()¶ If current geometry was in quadrant reduced version, converts it to full version, keeping essential parameters the same.
Warning
Quadrant reduction is still experimental.
Note
Will set
fnGeoback to default value inmeshfilesfolder.Returns: Updated geometry. Return type: pyfrp.subclasses.pyfrp_geometry.geometry
-
geometry2Quad()¶ Converts current geometry to quadrant reduced version if available, keeping essential parameters the same.
If geometry is already reduced or there is no quadrant version of the geometry, will do nothing and return unchanged geometry.
Warning
Quadrant reduction is still experimental.
Note
Will set
fnGeoback to default value inmeshfilesfolder.Returns: Updated geometry. Return type: pyfrp.subclasses.pyfrp_geometry.geometry
-
getDataEnc()¶ Returns current data encoding.
-
getDataFT()¶ Returns current data filetype.
-
getDataFolder()¶ Returns folder containing recovery data files.
-
getDataResMu()¶ Returns resolution of data in \(\um m\) .
-
getDataResPx()¶ Returns resolution of data in px.
-
getFileList()¶ Returns list of recovery data files.
-
getFitByName(name)¶ Returns fit in
fitslist with namename.If it doesn’t exists, returns
None.
-
getFrameInterval()¶ Returns current frame interval.
-
getFreeROIId()¶ Returns first free ID of ROIs.
-
getGeometry()¶ Returns embryo’s geometry object.
Returns: PyFRAP geometry object. Return type: pyfrp.subclasses.pyfrp_geometry.geometry
-
getInterpolationError()¶ Prints out interpolation error by ROI.
-
getMasterROI()¶ Returns master ROI.
-
getMasterROIIdx()¶ Returns index of master ROI
-
getNFrames()¶ Returns current number of frames.
-
getName()¶ Returns embryo name.
-
getOptimalAllROI(name='All', makeNew=False)¶ Readjusts ROI with name All (if existent) to cover whole geometry.
-
getROIById(Id)¶ Returns ROI in
ROIslist with specified ID.If ROI with
Iddoes not exist, returnsNone.
-
getROIByName(name)¶ Returns ROI in
ROIslist with specified name.If ROI with
namedoes not exist, returnsNone.
-
getROIIdx(r)¶ Returns index of ROI in
ROIslist.Returns
-1if ROI is not in list.Parameters: r (pyfrp.subclasses.pyfrp_ROI.ROI) – Some ROI. Returns: Index of ROI. Return type: int
-
getROIs()¶ Returns
ROIslist.
-
getRimFactorByPx(radius, px)¶ Returns the correct rimFactor if a rim of with
pxin a ROI of radiusradiusis desired.Rim factor \(f\) is then given by:
\[f=1-\frac{p}{r},\]where \(p\) is
pxand \(r\) isradius.Parameters: - radius (float) – Radius of ROI.
- px (float) – Number of pixels that rim should be wide.
Returns: Calculated rim factor.
Return type: float
-
getTEnd()¶ Returns current exerpiment end time.
-
getTStart()¶ Returns current exerpiment start time.
-
getTvecData()¶ Returns current data time vector.
-
isAnalyzed()¶ Returns
Trueif all ROIs have been analyzed.
-
isFitted()¶ Returns
Trueif all fits are fitted.
-
isSimulated()¶ Returns
Trueif all ROIs have been simulated.
-
listROIs()¶ Prints out all ROIs and their respective type.
-
loadDataImg(idx)¶ Loads data image in
fnDatafolderof indexidx.Parameters: idx (int) – Index of data image to be loaded. Returns: Loaded image. Return type: numpy.ndarray
-
makeQuadReducable(auto=False, debug=False)¶ Makes embryo quadrant reducable by:
- Checks if embryo is reducable to quadrant by checking if all ROIs are either point or axis symmetric around geometry center.
- Tries to readjust non-symmetric ROIs to make them quad-reducable.
- If ROIs are reducable, will center geometry at center of data image.
Note
You want to call :py:meth:showAllROIBoundaries and :py:meth:computeROIIdxs afterwards to make sure everything went properly.
Warning
Quadrant reduction is still experimental.
Keyword Arguments: - tryFix (bool) – Tries to readjust ROIs into reducable form.
- auto (bool) – Readjust ROIs automatically.
- debug (bool) – Print debugging messages.
Returns: True if embryo is reducable.
Return type: bool
-
newAnalysis()¶ Creates new
pyfrp.subclasses.pyfrp_analysis.analysisobject and sets it as embryos’sanalysis.Returns: New analysis object. Return type: pyfrp.subclasses.pyfrp_analysis.analysis
-
newCustomROI(name, Id, color='b', asMaster=False)¶ Creates new
pyfrp.subclasses.pyfrp_ROI.customROIobject and adds it to theROIslist of embryo object.Note
You can use
getFreeROIId()to find a unused ID for the newROI.Parameters: - name (str) – Name of new ROI.
- Id (int) – ID of new ROI.
Keyword Arguments: - color (str) – Color of ROI.
- asMaster (bool) – Set ROI as master ROI?
Returns: Newly created ROI object.
Return type:
-
newFit(name)¶ Creates new fit object and appends it to list of fits.
Parameters: name (str) – Name of fit object. Returns: Newly created fit. Return type: pyfrp.subclasses.pyfrp_fit.fit
-
newPolyROI(name, Id, corners, color='b', asMaster=False)¶ Creates new
pyfrp.subclasses.pyfrp_ROI.polyROIobject and adds it to theROIslist of embryo object.Each corner given in
cornerslist must be a list of form[x,y].Note
Polygon is automatically closed.
Note
You can use
getFreeROIId()to find a unused ID for the newROI.Parameters: - name (str) – Name of new ROI.
- Id (int) – ID of new ROI.
- corners (list) – List of
[x,y]coordinates describing corners.
Keyword Arguments: - color (str) – Color of ROI.
- asMaster (bool) – Set ROI as master ROI?
Returns: Newly created ROI object.
Return type:
-
newPolySliceROI(name, Id, corners, height, width, sliceBottom, color='b', asMaster=False)¶ Creates new
pyfrp.subclasses.pyfrp_ROI.polySliceROIobject and adds it to theROIslist of embryo object.Each corner given in
cornerslist must be a list of form[x,y].Note
Polygon is automatically closed.
Note
You can use
getFreeROIId()to find a unused ID for the newROI.Note
If
sliceBottom==True, slice ranges fromheight<=z<=height+width, otherwise fromheight-width/2<=z<=height+width/2.Parameters: - name (str) – Name of new ROI.
- Id (int) – ID of new ROI.
- center (list) – Center of radial ROI.
- corners (list) – List of
[x,y]coordinates describing corners. - width (float) – width in z-direction of slice.
- sliceBottom (bool) – Put origin of slice at botton of slice.
Keyword Arguments: - color (str) – Color of ROI.
- asMaster (bool) – Set ROI as master ROI?
Returns: Newly created ROI object.
Return type:
-
newROI(name, Id, zmin='-inf', zmax='inf', color='b', asMaster=False)¶ Creates new simple
pyfrp.subclasses.pyfrp_ROI.ROIobject and adds it to theROIslist of embryo object.Note
You can use
getFreeROIId()to find a unused ID for the newROI.Parameters: - name (str) – Name of new ROI.
- Id (int) – ID of new ROI.
Keyword Arguments: - zmin (float) – Lower boundary in z-direction.
- zmax (float) – upper boundary in z-direction.
- color (str) – Color of ROI.
- asMaster (bool) – Set ROI as master ROI?
Returns: Newly created ROI object.
Return type:
-
newRadialROI(name, Id, center, radius, color='b', asMaster=False)¶ Creates new
pyfrp.subclasses.pyfrp_ROI.radialROIobject and adds it to theROIslist of embryo object.Note
You can use
getFreeROIId()to find a unused ID for the newROI.Parameters: - name (str) – Name of new ROI.
- Id (int) – ID of new ROI.
- center (list) – Center of radial ROI.
- radius (float) – Radius of radial ROI.
Keyword Arguments: - color (str) – Color of ROI.
- asMaster (bool) – Set ROI as master ROI?
Returns: Newly created ROI object.
Return type:
-
newRadialSliceROI(name, Id, center, radius, height, width, sliceBottom, color='b', asMaster=False)¶ Creates new
pyfrp.subclasses.pyfrp_ROI.radialSliceROIobject and adds it to theROIslist of embryo object.Note
You can use
getFreeROIId()to find a unused ID for the newROI.Note
If
sliceBottom==True, slice ranges fromheight<=z<=height+width, otherwise fromheight-width/2<=z<=height+width/2.Parameters: - name (str) – Name of new ROI.
- Id (int) – ID of new ROI.
- center (list) – Center of radial ROI.
- radius (float) – Radius of radial ROI.
- height (float) – z-coordinate of slice.
- width (float) – width in z-direction of slice.
- sliceBottom (bool) – Put origin of slice at botton of slice.
Keyword Arguments: - color (str) – Color of ROI.
- asMaster (bool) – Set ROI as master ROI?
Returns: Newly created ROI object.
Return type:
-
newRectangleROI(name, Id, offset, sidelengthX, sidelengthY, color='b', asMaster=False)¶ Creates new
pyfrp.subclasses.pyfrp_ROI.rectangleROIobject and adds it to theROIslist of embryo object.Note
Offset is set to be left-bottom corner of rectangle.
Note
You can use
getFreeROIId()to find a unused ID for the newROI.Parameters: - name (str) – Name of new ROI.
- Id (int) – ID of new ROI.
- offset (list) – Offset of of square.
- sidelengthX (float) – Sidelength of rectangle in x-direction.
- sidelengthY (float) – Sidelength of rectangle in y-direction.
Keyword Arguments: - color (str) – Color of ROI.
- asMaster (bool) – Set ROI as master ROI?
Returns: Newly created ROI object.
Return type:
-
newRectangleSliceROI(name, Id, offset, sidelengthX, sidelengthY, height, width, sliceBottom, color='b', asMaster=False)¶ Creates new
pyfrp.subclasses.pyfrp_ROI.rectangleSliceROIobject and adds it to theROIslist of embryo object.Note
Offset is set to be left-bottom corner of rectangle.
Note
You can use
getFreeROIId()to find a unused ID for the newROI.Note
If
sliceBottom==True, slice ranges fromheight<=z<=height+width, otherwise fromheight-width/2<=z<=height+width/2.Parameters: - name (str) – Name of new ROI.
- Id (int) – ID of new ROI.
- center (list) – Center of radial ROI.
- offset (list) – Offset of of rectangle.
- sidelengthX (float) – Sidelength of rectangle in x-direction.
- sidelengthY (float) – Sidelength of rectangle in y-direction.
- width (float) – width in z-direction of slice.
- sliceBottom (bool) – Put origin of slice at botton of slice.
Keyword Arguments: - color (str) – Color of ROI.
- asMaster (bool) – Set ROI as master ROI?
Returns: Newly created ROI object.
Return type:
-
newSimulation()¶ Creates new
pyfrp.subclasses.pyfrp_simulation.simulationobject and sets it as embryos’ssimulation.Returns: New simulation object. Return type: pyfrp.subclasses.pyfrp_simulation.simulation
-
newSliceROI(name, Id, height, width, sliceBottom, color='b', asMaster=False)¶ Creates new
pyfrp.subclasses.pyfrp_ROI.sliceROIobject and adds it to theROIslist of embryo object.Note
You can use
getFreeROIId()to find a unused ID for the newROI.Note
If
sliceBottom==True, slice ranges fromheight<=z<=height+width, otherwise fromheight-width/2<=z<=height+width/2.Parameters: - name (str) – Name of new ROI.
- Id (int) – ID of new ROI.
- height (float) – z-coordinate of slice.
- width (float) – width in z-direction of slice.
- sliceBottom (bool) – Put origin of slice at botton of slice.
Keyword Arguments: - color (str) – Color of ROI.
- asMaster (bool) – Set ROI as master ROI?
Returns: Newly created ROI object.
Return type:
-
newSquareROI(name, Id, offset, sidelength, color='b', asMaster=False)¶ Creates new
pyfrp.subclasses.pyfrp_ROI.squareROIobject and adds it to theROIslist of embryo object.Note
Offset is set to be left-bottom corner of square.
Note
You can use
getFreeROIId()to find a unused ID for the newROI.Parameters: - name (str) – Name of new ROI.
- Id (int) – ID of new ROI.
- offset (list) – Offset of of square.
- sidelength (float) – Sidelength of square.
Keyword Arguments: - color (str) – Color of ROI.
- asMaster (bool) – Set ROI as master ROI?
Returns: Newly created ROI object.
Return type:
-
newSquareSliceROI(name, Id, offset, sidelength, height, width, sliceBottom, color='b', asMaster=False)¶ Creates new
pyfrp.subclasses.pyfrp_ROI.squareSliceROIobject and adds it to theROIslist of embryo object.Note
Offset is set to be left-bottom corner of square.
Note
You can use
getFreeROIId()to find a unused ID for the newROI.Note
If
sliceBottom==True, slice ranges fromheight<=z<=height+width, otherwise fromheight-width/2<=z<=height+width/2.Parameters: - name (str) – Name of new ROI.
- Id (int) – ID of new ROI.
- center (list) – Center of radial ROI.
- offset (list) – Offset of of square.
- sidelength (float) – Sidelength of square.
- width (float) – width in z-direction of slice.
- sliceBottom (bool) – Put origin of slice at botton of slice.
Keyword Arguments: - color (str) – Color of ROI.
- asMaster (bool) – Set ROI as master ROI?
Returns: Newly created ROI object.
Return type:
-
pinAllROIs(bkgdVal=None, normVal=None, bkgdValSim=None, normValSim=None, useMin=False, useMax=False, debug=False)¶ Pins both simulation and data vectors of all ROIs.
Note
If no bkgdVal or normVal is giving, will try to compute it using
computePinVals(). Only then input ofuseMaxanduseMinare relevant.Keyword Arguments: - bkgdVal (float) – Background value used for data pinning.
- normVal (float) – Norming value used for data pinning.
- bkgdValSim (float) – Background value used for simulation pinning.
- normValSim (float) – Norming value used for simulation pinning.
- useMin (bool) – Use minimum value for background computation.
- useMax (bool) – Use maximum value for norm value computation.
- debug (bool) – Print debugging messages.
Returns: Updated list of ROIs.
Return type: list
-
plotAllData(ax=None, legend=True)¶ Plots all data timeseries for all ROIs in
ROIslist.If no axes are given via
ax, will create new matplotlib axes.Keyword Arguments: - ax (matplotlib.axes) – Axes to be plotted in.
- legend (bool) – Show legend in plot.
Returns: Axes used for plotting.
Return type: matplotlib.axes
-
plotAllDataPinned(ax=None, legend=True)¶ Plots all pinned data timeseries for all ROIs in
ROIslist.If no axes are given via
ax, will create new matplotlib axes.Keyword Arguments: - ax (matplotlib.axes) – Axes to be plotted in.
- legend (bool) – Show legend in plot.
Returns: Axes used for plotting.
Return type: matplotlib.axes
-
plotAllSim(ax=None, legend=True)¶ Plots all simulation timeseries for all ROIs in
ROIslist.If no axes are given via
ax, will create new matplotlib axes.Keyword Arguments: - ax (matplotlib.axes) – Axes to be plotted in.
- legend (bool) – Show legend in plot.
Returns: Axes used for plotting.
Return type: matplotlib.axes
-
plotAllSimPinned(ax=None, legend=True)¶ Plots all pinned simulation timeseries for all ROIs in
ROIslist.If no axes are given via
ax, will create new matplotlib axes.Keyword Arguments: - ax (matplotlib.axes) – Axes to be plotted in.
- legend (bool) – Show legend in plot.
Returns: Axes used for plotting.
Return type: matplotlib.axes
-
printAllAttr(full=False)¶ Prints out all attributes of embryo object.
-
quickAnalysis(maxDExpPx=None, timeScale='log')¶ Performs complete FRAP analysis of embryo object including:
- Finding ROI indices by calling
computeROIIdxs(). - Running image analysis through
pyfrp.subclasses.pyfrp_analysis.analysis.run(). - Generating optimal time simulation vector through
pyfrp.subclasses.pyfrp_simulation.simulation.getOptTvecSim() - Running simulation through
pyfrp.subclasses.pyfrp_simulation.simulation.run(). - Pin simulation and data timeseries using
computeIdealFRAPPinVals()andpinAllROIs(). - Run all fits in
fitslist by callingpyfrp.subclasses.pyfrp_fit.fit.run()
Keyword Arguments: - maxDExpPx (float) – Maximum expected diffusion coefficient.
- timeScale (str) – Linear (
'lin') or logarithmic ('log') time scaling.
- Finding ROI indices by calling
-
removeROI(i)¶ Removes ROI of index
i.
-
renameMeshFiles(fn=None, debug=False)¶ Renames meshfiles associated with embryo fo
fn.If
fn=Nonewill rename toself.name.ext, whereextis either.geoor.msh.Example:
>>> emb.geometry.getFnGeo()
>>> path/to/meshfiles/dome.geo
>>> emb.getName()
>>> myEmbryo
>>> emb.renameMeshFiles()
>>> emb.geometry.getFnGeo()
>>> path/to/meshfiles/myEmbryo.geo
Note
Will automatically update
geometry.fnGeoandsimulation.mesh.fnMeshproperties.Keyword Arguments: - fn (str) – Desired filename.
- debug (bool) – Print out debugging messages.
Returns: Tuple containing:
- fnGeoNew (str): New path to geometry file.
- fnMeshNew (str): New path to mesh file.
Return type: tuple
-
save(fn=None, copyMeshFiles=True, debug=False)¶ Saves embryo object to pickle file.
If
fn=Nonewill save toself.name.emb.Keyword Arguments: - fn (str) – Output filename.
- copyMeshFiles (bool) – Copy meshfiles to embryo file destination.
- debug (bool) – Print out debugging messages.
Returns: Output filename.
Return type: str
-
setDataEnc(e)¶ Sets data encoding of datasets, for example
uint16.
-
setDataFT(f)¶ Sets data filetype of datasets, for example .tif .
-
setDataFolder(fn)¶ Set folder containing recovery data files.
Will automatically try to update
fileListby callingupdateFileList().Parameters: fn (str) – Path to folder containing data files. Returns: New data folder path. Return type: str
-
setDataResMu(res)¶ Sets resolution of data in \(\mu m\).
-
setDataResPx(res)¶ Sets resolution of data in px.
-
setEmbryo2Full()¶ Sets both geometry and ROIs to full mode.
Returns: Tuple Containing: self.geometry(pyfrp.subclasses.pyfrp_geometry.geometry): Updated geometry.self.ROIs(list): Updated list of ROIs.
Return type: tuple
-
setEmbryo2Quad()¶ Reduces both geometry and ROIs of embryo to quadrant, such that embryo object is fully quadrant reduced.
Returns: Tuple Containing: self.geometry(pyfrp.subclasses.pyfrp_geometry.geometry): Updated geometry.self.ROIs(list): Updated list of ROIs.
Return type: tuple
-
setFileList(l)¶ Sets file list to
l.
-
setFrameInterval(dt)¶ Sets interval between imaging frames, then updates all time vectors.
Parameters: dt (float) – New frame interval in seconds. Returns: Set frame interval. Return type: float
-
setGeometry2Ball(center, imagingRadius)¶ Sets embryo’s geometry to
pyfrp.subclasses.pyfrp_geometry.ball.Parameters: - center (list) – Center of geometry.
- imagingRadius (float) – Radius of embryo in imaging slice.
Returns: New ball geometry.
Return type: pyfrp.subclasses.pyfrp_geometry.ball
-
setGeometry2BallQuad(center, imagingRadius)¶ Sets embryo’s geometry to
pyfrp.subclasses.pyfrp_geometry.ballQuad.Warning
Quadrant reduction is still experimental.
Parameters: - center (list) – Center of geometry.
- imagingRadius (float) – Radius of embryo in imaging slice.
Returns: New ball quadrant geometry.
Return type: pyfrp.subclasses.pyfrp_geometry.ball
-
setGeometry2Cone(center, upperRadius, lowerRadius, height)¶ Sets embryo’s geometry to
pyfrp.subclasses.pyfrp_geometry.cone.Parameters: - center (list) – Center of geometry.
- upperRadius (float) – Radius at upper end of cone.
- lowerRadius (float) – Radius at lower end of cone.
- height (float) – Height of cylinder.
Returns: New cone geometry.
Return type:
-
setGeometry2Custom(center, fnGeo='')¶ Sets embryo’s geometry to
pyfrp.subclasses.pyfrp_geometry.custom.Parameters: - center (list) – Center of geometry.
- fnGeo (str) – Path to geometry file.
Returns: New custom geometry.
Return type:
-
setGeometry2Cylinder(center, radius, height)¶ Sets embryo’s geometry to
pyfrp.subclasses.pyfrp_geometry.cylinder.Parameters: - center (list) – Center of geometry.
- radius (float) – Radius of cylinder.
- height (float) – Height of cylinder.
Returns: New cylinder geometry.
Return type:
-
setGeometry2CylinderQuad(center, radius, height)¶ Sets embryo’s geometry to
pyfrp.subclasses.pyfrp_geometry.cylinderQuad.Warning
Quadrant reduction is still experimental.
Parameters: - center (list) – Center of geometry.
- radius (float) – Radius of cylinder.
- height (float) – Height of cylinder.
Returns: New cylinder quadrant geometry.
Return type:
-
setGeometry2ZebraFishDomeStage(center, imagingRadius, radiusScale=1.1)¶ Sets embryo’s geometry to
pyfrp.subclasses.pyfrp_geometry.zebrafishDomeStage.Parameters: - center (list) – Center of geometry.
- imagingRadius (float) – Radius of embryo at imaging slice.
Keyword Arguments: radiusScale (float) – Scaling factor defining how much bigger outer radius is to inner radius.
Returns: New zebrafish geometry.
Return type:
-
setGeometry2ZebraFishDomeStageQuad(center, imagingRadius, radiusScale=1.1)¶ Sets embryo’s geometry to
pyfrp.subclasses.pyfrp_geometry.zebrafishDomeStageQuad.Warning
Quadrant reduction is still experimental.
Parameters: - center (list) – Center of geometry.
- imagingRadius (float) – Radius of embryo at imaging slice.
Keyword Arguments: radiusScale (float) – Scaling factor defining how much bigger outer radius is to inner radius.
Returns: New zebrafish quadrant geometry.
Return type:
-
setMasterROIIdx(idx)¶ Define ROI with index
idxas master ROI.
-
setNFrames(n)¶ Sets number of frames, then updates all time vectors.
-
setName(n)¶ Sets embryo name.
-
setSideLengthBleachedMu(s)¶ Sets sidelength of bleached square in \(\mu m\), will then update bleached region parameters by calling
updateBleachedRegion().Warning
Attributes
sideLengthBleachedMuandoffsetBleachedPxwill deprecated in further versions. Bleached region definition will then solely rely on ROI definitions.
-
setSliceDepthMu(d, updateGeometry=True)¶ Sets resolution of data in \(\mu m\) and then updates all dimensions of embryo object data rely on
sliceDepthMu.If
updateGeometryis selected, will automatically update geometry.Note
Not every geometry depends on slice depth. If the geometry object has a method
restoreDefault, this will be called. Otherwise geometry is not updated.Parameters: d (float) – New slice depth in \(\mu m\). Keyword Arguments: updateGeometry (bool) – Update geometry. Returns: New slice depth. Return type: float
-
setTEnd(t)¶ Sets end time of experiment, then updates all time vectors.
Parameters: t (float) – End time in seconds. Returns: Set end time. Return type: float
-
setTStart(t)¶ Sets start time of experiment, then updates all time vectors.
Parameters: t (float) – Start time in seconds. Returns: Set start time. Return type: float
-
showAllROIBoundaries(ax=None, withImg=False, idx=0)¶ Shows boundaries of all ROIs in
ROIslist.If no axes are given via
ax, will create new matplotlib axes.Keyword Arguments: - ax (matplotlib.axes) – Axes to be plotted in.
- withImg (bool) – Shows data image inside same axes.
- idx (int) – Index of data image to be shown.
Returns: Axes used for plotting.
Return type: matplotlib.axes
-
showAllROIIdxs(axes=None)¶ Shows image, extended and mesh indices of all ROIs in
ROIslist.If no axes are given via
axes, will create new list of matplotlib axes. If axes are given, they should havelen(axes)=3*len(ROIs).Note
If the mesh has a large number of nodes, this can take up a lot of memory due to every node being plotted in a matplotlib scatter plot.
Keyword Arguments: axes (list) – List of matplotlib.axes to be plotted in. Returns: List of axes used for plotting. Return type: matplotlib.axes
-
showDataImg(ax=None, idx=0)¶ Shows data image in
fnDatafolderof indexidx.If no axes are given via
ax, will create new matplotlib axes.Keyword Arguments: idx (int) – Index of data image to be shown. Returns: Axes used for plotting. Return type: matplotlib.axes
-
sliceEmbryo(nSlices, direction='z')¶ Slices embryo in z-direction in
nSlices.Creates
nSlicesnewpyfrp.subclasses.pyfrp_ROI.sliceROIROIs and appends them toROIslist.Note
Slice ROIs will be created with
sliceBottom=False.Parameters: nSlices (int) – Number of slices embryo is supposed to get cut. Returns: Updates ROIslist.Return type: list
-
updateBleachedRegion()¶ Updates sidelength and offset of bleached square in px.
Bleached region is defined around center of image. That is, the offset is set to
\[x_{\mathrm{offset}} = \frac{1}{2}(r_{\mathrm{px}},r_{\mathrm{px}})^T - (s_{\mathrm{bleached,px}},s_{\mathrm{bleached,px}})^T\]where \(r_{\mathrm{px}}\) is the resolution of the data in pixel, and \(s_{\mathrm{bleached,px}\) is the sidelength of the bleached square in pixel.
Warning
Attributes
sideLengthBleachedMuandoffsetBleachedPxwill deprecated in further versions. Bleached region definition will then solely rely on ROI definitions.
-
updateFileList()¶ Updates file list containing all names of recovery images.
If new
fileListis not empty, will update number of frames to match number of files infileListby callingupdateNFrames().Returns: Updated file list. Return type: list
-
updateNFrames()¶ Updates number of frames, then updates all time vectors.
Note
Gets number of frames by reading number of files of type
dataFTinfnDatafolder. So you should make sure that there are no extra files infnDatafolder.Returns: Updated number of frames. Return type: int
-
updatePxDimensions()¶ Updates all all convFact relevant attributes.
Returns: Tuple containing: - sliceWidthPx (float): Updated slice width in px.
- sliceDepthPx (float): Updated slice depth in px.
- sliceHeightPx (float): Updated slice height in px.
- sideLengthBleachedPx (float): Updated side length of bleached square in px.
- offsetBleachedPx (float): Updated offset if bleached square in px.
Return type: tuple
-
updateTimeDimensions(simUpdate=True)¶ Updates time dimensions using information in
frameInterval,nFramesandtStart.Note
If embryo object already possesses simulation object, will update simulation time dimensions using
pyfrp.subclasses.pyfrp_simulation.simulation.toDefaultTvec(). If you have different settings in simulation vector that you want to preserve, selectsimUpdate=False.Keyword Arguments: simUpdate (bool) – Update simulation time dimensions. Returns: Updated data time vector. Return type: numpy.ndarray
-
updateVersion()¶ Updates embryo object to current version, making sure that it possesses all attributes.
Creates a new embryo object and compares
selfwith the new embryo object. If the new embryo object has a attribute thatselfdoes not have, will add attribute with default value from the new embryo object.Returns: selfReturn type: pyfrp.subclasses.pyfrp_embryo.embryo
pyfrp.subclasses.pyfrp_fit module
Essential PyFRAP module containing pyfrp.subclasses.pyfrp_fit.fit class.
-
class
pyfrp.subclasses.pyfrp_fit.fit(embryo, name)¶ Main fit class of PyFRAP.
The purpose of the fit class is to save all attributes used for fitting PyFRAP simulation results to data analysis results. The main attributes are:
Fitting algorithm specifics:
- Fitting algorithm, see also
setOptMeth(). - Stopping criteria, see also
setMaxfun()andsetOptTol(). - Initial guess, see also
getX0(). - Boundaries, see also
getBounds().
- Fitting algorithm, see also
Fitting options:
fitProd, see alsogetFitProd().fitDegr, see alsogetFitDegr().fitPinned, see alsogetFitPinned().equOn, see alsogetEqu().fitCutOffT, see alsogetFitCutOffT().
The ROIs to be fitted, see also
getROIsFitted().Fitting results, see also
printResults().Fitted vectors.
The most important methods are:
run(): Runs fitting.addROIByName(): Adds ROI to be used for fitting.getX0(): Builds and returns current initial guess.getBounds(): Builds and returns current bounds.computeStats(): Compares post-fitting statistics.
The fit uses simulation and data vectors stored in all
pyfrp.subclasses.pyfrp_ROI.ROIobjects defined inROIsFittedlist to compute the optimal values forDOptMu(prodOptordegrOptiffitProdorfitDegris selected, respectively).After calling
run(), will automatically compute properx0viagetX0()andgetBounds().Parameters: - embryo (pyfrp.subclasses.pyfrp_embryo.embryo) – Embryo object that fit belongs to.
- name (str) – Name of fit.
-
addROI(r)¶ Adds ROI to the list of fitted ROIs.
Parameters: r (pyfrp.subclasses.pyfrp_ROI.ROI) – ROI to be used for fitting. Returns: Updated list of ROIs used for fitting. Return type: list
-
addROIById(Id)¶ Adds ROI to the list of fitted ROIs, given a specific ROI Id.
Parameters: Id (int) – Id of ROI to be used for fitting. Returns: Updated list of ROIs used for fitting. Return type: list
-
addROIByName(name)¶ Adds ROI to the list of fitted ROIs, given a specific name.
Parameters: name (str) – Name of ROI to be used for fitting. Returns: Updated list of ROIs used for fitting. Return type: list
-
assignOptParms(res)¶ Assigns optimal parameters found by optimization algorithm to attributes in fit object depending on fit options chosen.
Parameters: res (list) – Result array from optimization algorithm. Returns: Tuple containing: - DOptPx (float): Optimal diffusion coefficient in \(\frac{\mathrm{px}^2}{s}}\).
- prod (float): Optimal production rate in \(\frac{\[c\]}{s}}\).
- degr (float): Optimal degradation rate in \(\frac{1}{s}}\).
- DOptMu (float): Optimal diffusion coefficient in \(\frac{\mu\mathrm{m}^2}{s}}\).
Return type: tuple
-
checkPinned()¶ Checks if all ROIs in
ROIsFittedhave been pinned.Returns: Trueif all ROIs have been pinned,Falseelse.Return type: bool
-
checkSimulated()¶ Checks if all ROIs in
ROIsFittedhave been simulated.Returns: Trueif all ROIs have been simulated,Falseelse.Return type: bool
-
computeStats()¶ Computes stastics for fit.
Statistics include:
MeanRsqRsqRsqByROI
-
getBounds()¶ Generates tuple of boundary tuples, limiting parameters varied during SSD minimization.
Will generate exactly the boundary tuple that is currently useful to the optimization algorithm, meaning that only values that are needed since they are turned on via
fitProdorfitDegrwill be included into tuple.Will use values that are stored in
LBxandUBx, wherexisD,Prod, orDegrfor the creation of the tuples.Will also add a tuple of bounds defined via
LBEquandUBEqufor each ROI inROIsFitted.Note
Always gets executed at the start of
run.Returns: Boundary value tuple. Return type: tuple
-
getBruteInitDArray(steps=5)¶ Generates array of different possibilities to be used as initial guess for D.
If
LBDandUBDis given, will simply divide the range between the two in 4 equidistant values. Otherwise will vary aroundx0in 2 orders of magnitude.Keyword Arguments: steps (int) – How many initial guesses to generate. Returns: Array with possible initial guesses for D. Return type: list
-
getCutOffT()¶ Returns timepoint at which timeseries are cut if
fitCutOffTis turned on.Warning
This option is currently VERY experimental. Fitting might crash.
Returns: Timepoint. Return type: float
-
getEqu()¶ Returns equalization flag.
Returns: Current flag value. Return type: bool
-
getFitCutOffT()¶ Returns flag controlling if only the first
cutOffTtimesteps are supposed to be fitted.Warning
This option is currently VERY experimental. Fitting might crash.
Returns: Current flag value. Return type: bool
-
getFitDegr()¶ Returns flag controlling if a degredation term is supposed to be used for fitting.
Returns: Current flag value. Return type: bool
-
getFitPinned()¶ Returns flag controlling if pinned timeseries are supposed to be used for fitting.
Returns: Current flag value. Return type: bool
-
getFitProd()¶ Returns flag controlling if a production term is supposed to be used for fitting.
Returns: Current flag value. Return type: bool
-
getFittedParameterNames()¶ Returns names of parameters that are selected for fitting.
Returns: Names of parameters fitted. Return type: list
-
getKineticTimeScale()¶ Returns the kinetic time scale factor used for fitting.
Returns: Current kinetic time scale factor. Return type: float
-
getLBD()¶ Returns the lower bound for the diffusion rate.
Returns: Current lower bound for diffusion rate. Return type: float
-
getLBDegr()¶ Returns the lower bound for the degradation rate.
Returns: Current lower bound for degradation rate. Return type: float
-
getLBProd()¶ Returns the lower bound for the production rate.
Returns: Current lower bound for production rate. Return type: float
-
getMaxfun()¶ Returns maximum number of function evaluations at which optimization algorithm stops.
Returns: Current maximum number of function evaluations. Return type: int
-
getNParmsFitted(inclEqu=True)¶ Returns the number of parameters fitted in this fit.
Note
If equlalization is turned on, each ROI in
ROIsFittedcounts as an extra parameter.Example: We fit production and equalization for 2 ROIs, then we have fitted
- D
- degradation
- equalization ROI 1
- equalization ROI 2
leading to in total 4 fitted parameters.
Keyword Arguments: inclEqu (bool) – Include equalization as additional fitted parameter. Returns: Number of parameters fitted. Return type: int
-
getName()¶ Returns name of fit.
Returns: Name of fit. Return type: str
-
getOptMeth()¶ Returns the currently used optimization algorithm.
Returns: Optimization algorithm. Return type: str
-
getOptTol()¶ Returns tolerance level at which optimization algorithm stops.
Returns: Current tolerance level. Return type: float
-
getROIsFitted()¶ Returns list of ROIs used for fitting.
Returns: list of ROIs used for fitting. Return type: list
-
getSaveTrack()¶ Returns flag controlling if whole fitting process is supposed to be saved in fit object.
Returns: Current flag value. Return type: bool
-
getUBD()¶ Returns the upper bound for the diffusion rate.
Returns: Current upper bound for diffusion rate. Return type: float
-
getUBDegr()¶ Returns the upper bound for the degradation rate.
Returns: Current upper bound for degradation rate. Return type: float
-
getUBProd()¶ Returns the upper bound for the production rate.
Returns: Current upper bound for production rate. Return type: float
-
getX0()¶ Returns initial guess of fit in the form that is useful for the call of the optimization algorithm.
Copies x0 into local variable to pass to solver, pop entries that are currently not needed since they are turned off via
fitProdorfitDegr.Always appends initial guess for equalization factors, even though they might not been used.
Note
Always gets executed at the start of
run.Returns: Currently used x0. Return type: list
-
getX0D()¶ Returns the initial guess for the diffusion rate.
Returns: Initial guess for diffusion rate. Return type: float
-
getX0Degr()¶ Returns the initial guess for the degradation rate.
Returns: Initial guess for degration rate. Return type: float
-
getX0Equ(x)¶ Returns the initial guess for the equalization factor for all ROIs fitted.
Returns: Initial guess for equalization factor. Return type: list
-
getX0Prod()¶ Returns the initial guess for the production rate.
Returns: Initial guess for production rate. Return type: float
-
isFitted()¶ Checks if fit already has been run and succeeded.
Returns: Trueif success.Return type: bool
-
plotFit(ax=None, legend=True, title=None, show=True)¶ Plots fit, showing the result for all fitted ROIs.
Note
If no
axis given, will create new one.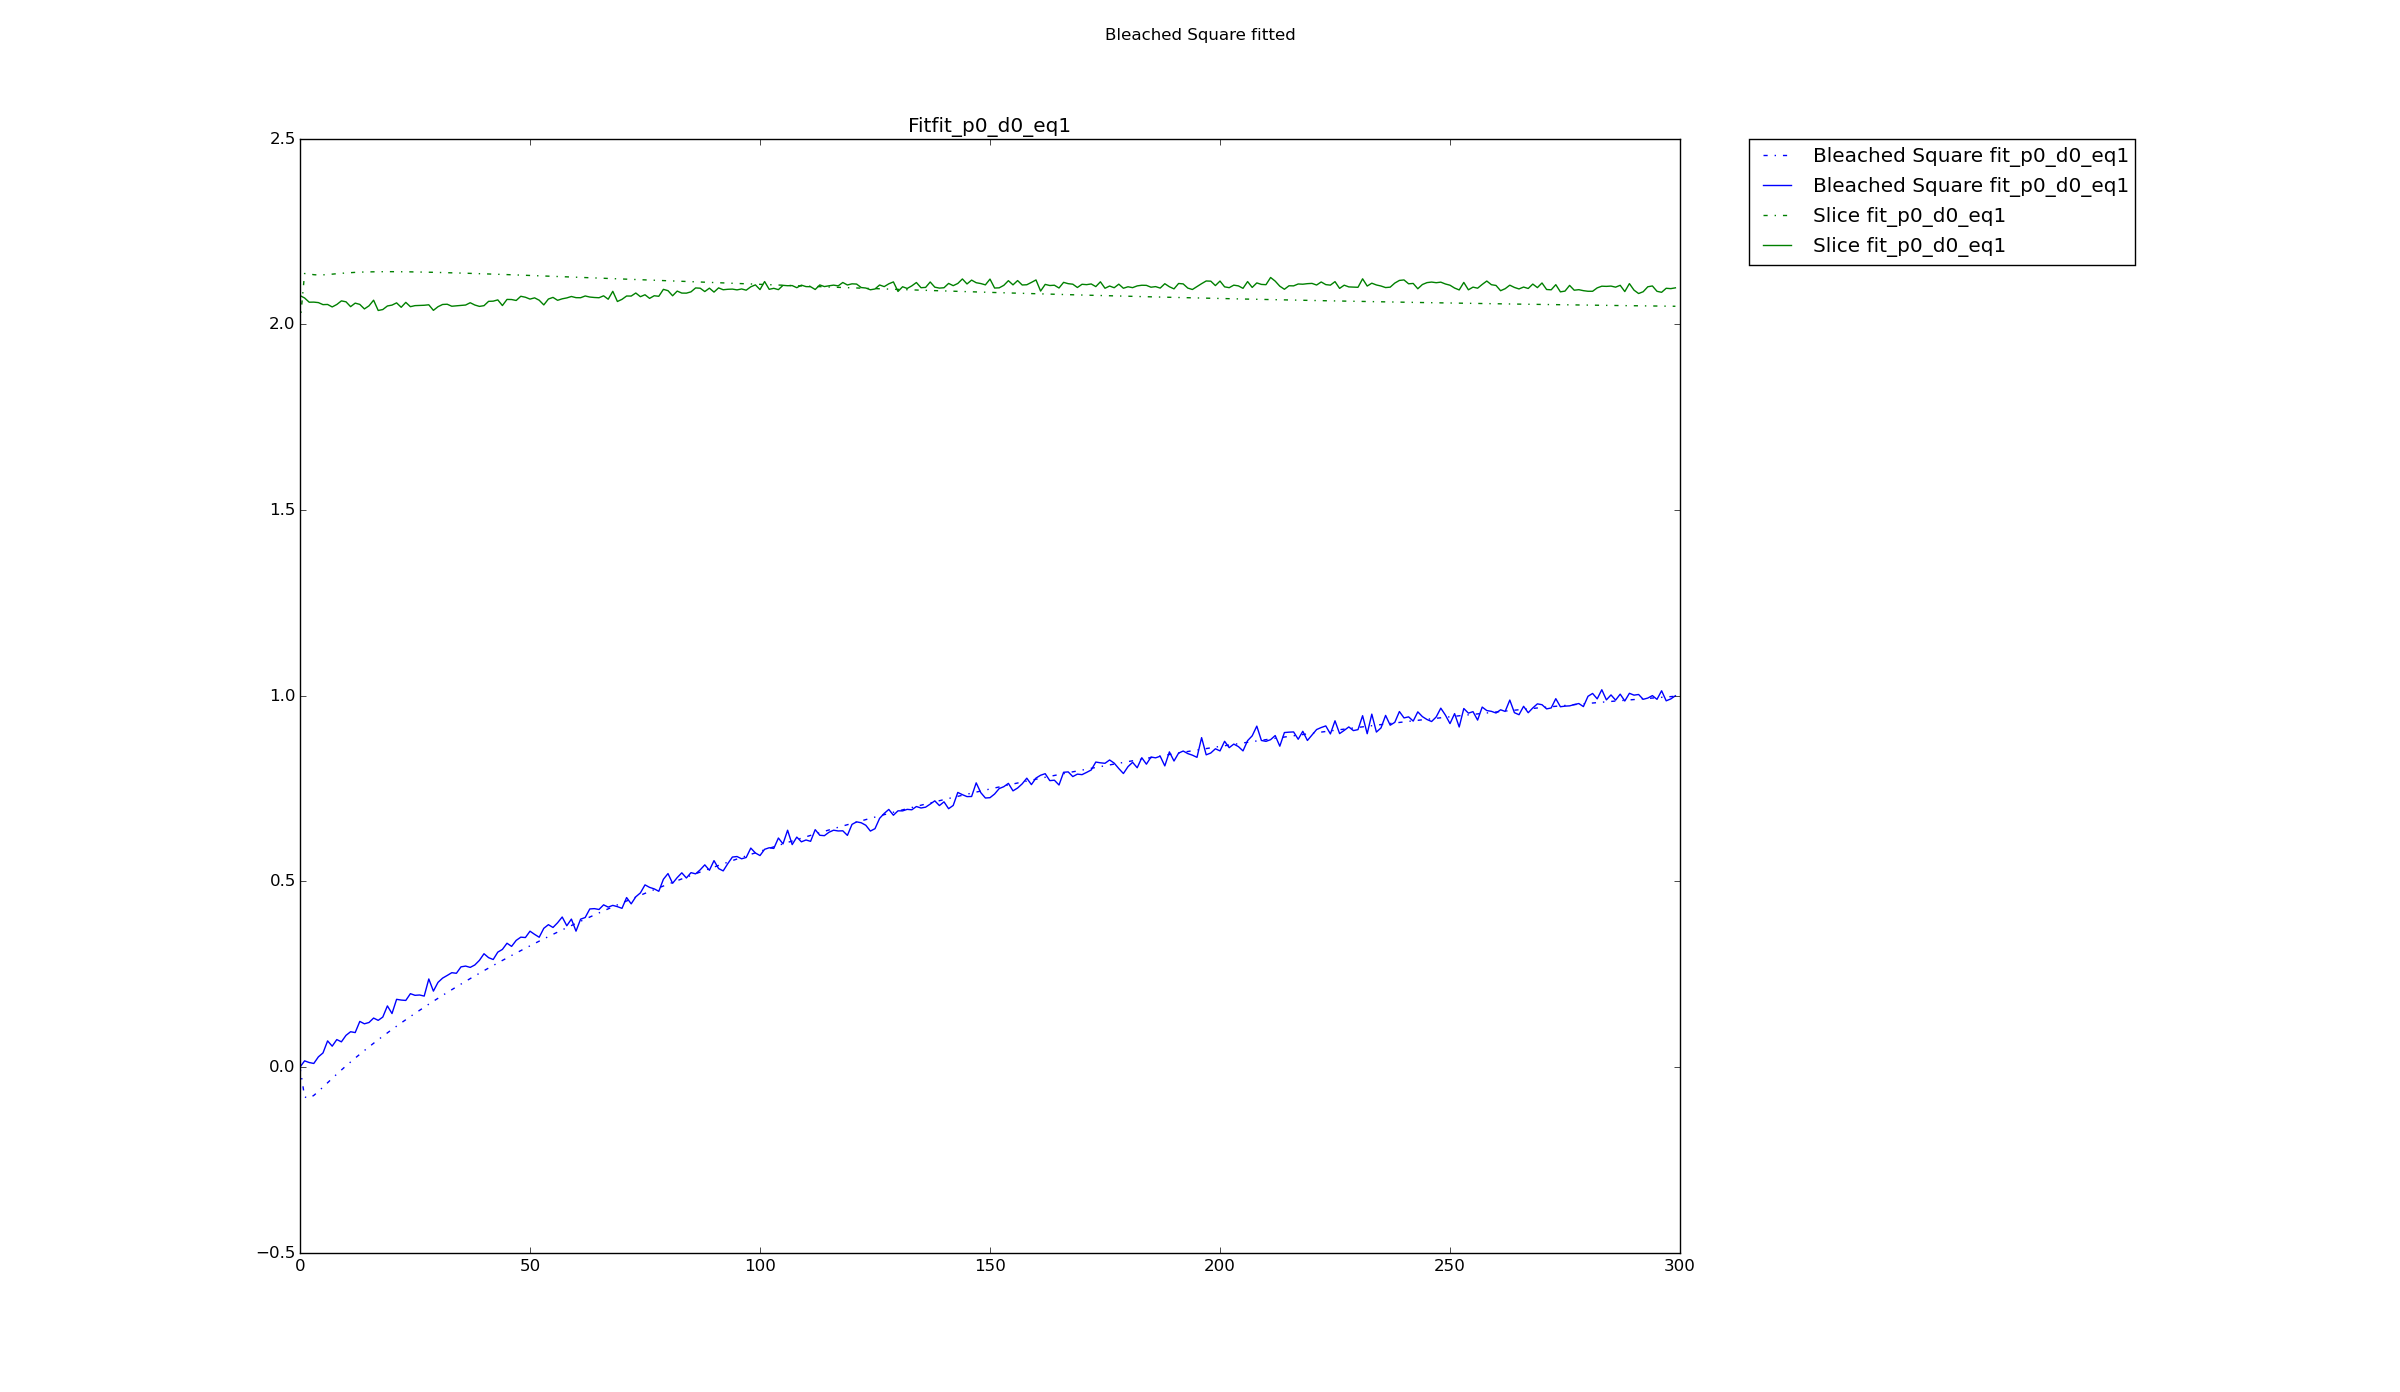
Keyword Arguments: - ax (matplotlib.axes) – Axes used for plotting.
- legend (bool) – Show legend.
- title (str) – Title of plot.
- show (bool) – Show plot.
Returns: Axes used for plotting.
Return type: matplotlib.axes
-
plotLikehoodProfiles(epsPerc=0.1, steps=100, debug=False)¶ Plots likelihood profiles for all fitted parameters.
Warning
Since we don’t yet fit the loglikelihood function, we only plot the SSD. Even though the SSD is proportional to the loglikelihood, it should be used carefully.
See also
pyfrp.modules.pyfrp_fit_module.plotFitLikehoodProfiles().Keyword Arguments: - epsPerc (float) – Percentage of variation.
- steps (int) – Number of values around optimal parameter value.
- debug (bool) – Show debugging messages
Returns: List of matplotlib.axes objects used for plotting.
Return type: list
-
printAllAttr()¶ Prints out all attributes of fit object.
-
printResults()¶ Prints out main results of fit.
-
printRsqByROI()¶ Prints out Rsq value per ROI.
-
removeROI(r)¶ Removes ROI from the list of fitted ROIs.
Parameters: r (pyfrp.subclasses.pyfrp_ROI.ROI) – ROI to be removed. Returns: Updated list of ROIs used for fitting. Return type: list
-
reset2DefaultX0()¶ Resets initial guess x0 to its default form.
The default form of x0 is
>>> [10., 0. ,0. , 1.,1.,1.]
The last entries are the initial guess of equlalization factors and is set to be list of of ones of the same length of
ROIsFitted.Returns: New initial guess x0. Return type: list
-
resultsToDict()¶ Extracts all important results into dictionary, making it easier for printout or csv extraction.
-
resultsToVec()¶ Puts results back in vector as optimization algorithm would return it.
Returns: Result vector. Return type: list
-
run(debug=False, ax=None)¶ Runs fit.
Fitting is done by passing fit object to
pyfrp.modules.pyfrp_fit_module.FRAPFitting(). This function then calls all necessary methods of fit to prepare it for optimization and then passes it to optimization algorithm.Note
If
bruteInitDis turned on, will executerunBruteInit()instead.Keyword Arguments: - debug (bool) – Print debugging messages.
- ax (matplotlib.axes) – Axes to show debugging plots in.
Returns: self.Return type:
-
runBruteInit(debug=False, ax=None, steps=5, x0Ds=[])¶ Runs fit for different initial guesses of the diffusion constant D, then selects the one that actually yielded the minimal SSD.
Initially guesses are generated with
getBruteInitDArray()if no arrayx0Dsis given.Fitting is done by passing fit object to
pyfrp.modules.pyfrp_fit_module.FRAPFitting(). This function then calls all necessary methods of fit to prepare it for optimization and then passes it to optimization algorithm.Will select the initial guess that yielded the minimal SSD and then rerun with this x0 again, making sure that everything is updated in fit object.
Keyword Arguments: - debug (bool) – Print debugging messages.
- ax (matplotlib.axes) – Axes to show debugging plots in.
- steps (int) – How many initial guesses to generate.
- x0Ds (list) – Array with possible initial guesses for D.
Returns: self.Return type:
-
setBruteInitD(b)¶ Turns on/off if the initial guess of for the diffusion rate D should be bruteforced.
Parameters: b (bool) – Flag value. Returns: Current flag value. Return type: bool
-
setCutOffT(t)
-
setEqu(b)¶ Turns on/off equalization.
Parameters: b (bool) – New flag value. Returns: New flag value. Return type: bool
-
setFitCutOffT(b)¶ Turns on/off if only a certain fraction of the timeseries is supposed to be fitted.
Warning
This option is currently VERY experimental. Fitting might crash.
Parameters: b (bool) – New flag value. Returns: New flag value. Return type: bool
-
setFitDegr(b)¶ Turns on/off if degradation is supposed to be considered in fit.
Parameters: b (bool) – New flag value. Returns: New flag value. Return type: bool
-
setFitPinned(b)¶ Turns on/off if pinned series are supposed to be fitted.
Parameters: b (bool) – New flag value. Returns: New flag value. Return type: bool
-
setFitProd(b)¶ Turns on/off if production is supposed to be considered in fit.
Parameters: b (bool) – New flag value. Returns: New flag value. Return type: bool
-
setKineticTimeScale(s)¶ Sets the kinetic time scale factor used for fitting.
Parameters: s (float) – New kinetic time scale factor.
-
setLBD(b)¶ Sets the lower bound for the diffusion rate.
Parameters: b (float) – New lower bound for diffusion rate.
-
setLBDegr(b)¶ Sets the lower bound for the degradation rate.
Parameters: b (float) – New lower bound for degradation rate.
-
setLBProd(b)¶ Sets the lower bound for the production rate.
Parameters: b (float) – New lower bound for production rate.
-
setMaxfun(m)¶ Sets maximum number of function evaluations at which optimization algorithm stops.
Parameters: m (int) – New maximum number of function evaluations.
-
setName(s)¶ Sets name of fit.
Parameters: s (str) – New name of fit.
-
setOptMeth(m)¶ Sets optimization method.
Available optimization methods are:
- Constrained Nelder-Mead
- Nelder-Mead
- TNC
- L-BFGS-B
- SLSQP
- brute
- BFGS
- CG
See also http://docs.scipy.org/doc/scipy-0.17.0/reference/generated/scipy.optimize.minimize.html and http://docs.scipy.org/doc/scipy-0.17.0/reference/generated/scipy.optimize.brute.html#scipy.optimize.brute .
You can find out more about the constrained Nelder-Mead algorithm in the documentation of
pyfrp.modules.pyfrp_optimization_module.constrObjFunc().Parameters: m (str) – New method.
-
setOptTol(m)¶ Sets tolerance level at which optimization algorithm stops.
Parameters: m (float) – New tolerance level.
-
setSaveTrack(b)¶ Turns on/off if fitting process is supposed to be stored.
This then can then be used to following the convergence of the optimization algorithm and possibly to identify local minima.
Parameters: b (bool) – New flag value. Returns: New flag value. Return type: bool
-
setUBD(b)¶ Sets the upper bound for the diffusion rate.
Parameters: b (float) – New upper bound for diffusion rate.
-
setUBDegr(b)¶ Sets the upper bound for the degradation rate.
Parameters: b (float) – New upper bound for degradation rate.
-
setUBProd(b)¶ Sets the upper bound for the production rate.
Parameters: b (float) – New upper bound for production rate.
-
setX0(x)¶ Sets the initial guess
x0.Argument
xneeds to have length 3, otherwise it is being rejected.Note
If
fitProdorfitDegrare not chosen, the values inx0are going to be used as static parameters.Parameters: x (list) – New desired initial guess. Returns: New initial guess. Return type: list
-
setX0D(x)¶ Sets the initial guess for the diffusion rate.
Parameters: x (float) – Initial guess for diffusion rate.
-
setX0Degr(x)¶ Sets the initial guess for the degradation rate.
Parameters: x (float) – Initial guess for degradation rate.
-
setX0Equ(x)¶ Sets the initial guess for the equalization factor.
Note
Does this for all ROIs in ROIsFitted.
Parameters: x (float) – Initial guess for equalization factor.
-
setX0Prod(x)¶ Sets the initial guess for the production rate.
Parameters: x (float) – Initial guess for production rate.
-
updateVersion()¶ Updates fit object to current version, making sure that it possesses all attributes.
Creates a new fit object and compares
selfwith the new fit object. If the new fit object has a attribute thatselfdoes not have, will add attribute with default value from the new fit object.Returns: selfReturn type: pyfrp.subclasses.pyfrp_fit.fit
pyfrp.subclasses.pyfrp_geometry module
PyFRAP module containing geometry classes. The geometry class is
a simple geometry class providing basic parameters and methods, parenting different
more specific geometries such as:
zebrafishDomeStage: Describing a zebrafish embryo in dome stage.cylinder: A simple cylinder.xenopusBall: A simple ball geometry (looking like a xenopus embryo).cone: A (truncated) cone.
For most of the geometries, this module also provides quadrant reduced versions of the geometry, reducing the geometry to the first quadrant around the center.
Note
Rules for adding new geometries:
- Always subclass from
geometry - Always center geometry around
geometry.center. That includes having defining the center in the .geo file bycenter_xandcenter_y. - Unit is pixels.
- Be careful with method overwrites. Use them wisely.
- Include the geometries into the GUI.
- Make them accessable by sharing them.
-
class
pyfrp.subclasses.pyfrp_geometry.cone(embryo, center, upperRadius, lowerRadius, height)¶ Bases:
pyfrp.subclasses.pyfrp_geometry.geometryGeometry describing a cut-off cone.
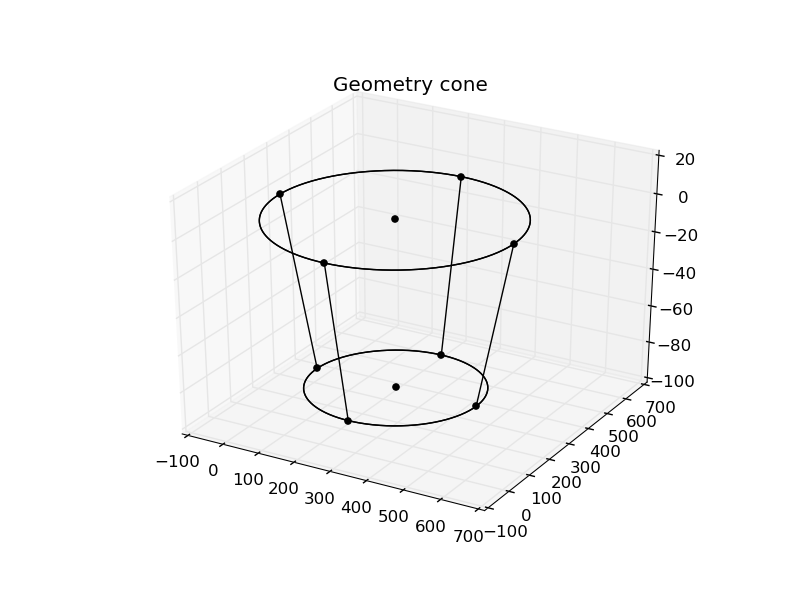
The crucial geometrical parameters are:
upperRadius: Upper radius of cone.lowerRadius: Lower radius of cone.height: Height of cone.
Note
Can also be extended to a real cone by setting
lowerRadius=0.-
computeRadiusFromSliceHeight(height)¶ Returns the slice radius given a slice height.
Slice radius is computed by
\[r(s) = \frac{l-u}{h} s +u\]where \(l,u\) are lower and upper radius respectively and \(h\) is cone height.
Parameters: height (float) – Slice height. Returns: Slice radius. Return type: float
-
computeSliceHeightFromRadius(radius)¶ Returns the slice height given a slice radius.
Slice height is computed by
\[s(r) = \frac{h}{l-u} (r-u)\]where \(l,u\) are lower and upper radius respectively and \(h\) is cone height.
Parameters: radius (float) – Slice radius. Returns: Slice height. Return type: float
-
genAsOpenscad()¶ Generates cone geometry as solid python object.
Useful if geometry is used to be passed to openscad.
Returns:
-
getHeight()¶ Returns cone radius.
-
getLowerRadius()¶ Returns lower radius of cone.
-
getUpperRadius()¶ Returns upper radius of cone.
-
getXYExtend()¶ Overwrites
pyfrp.subclasses.pyfrp_geometry.geometry.getXYExtend().By default, cone geometry is set to range from
center[i]-max([self.upperRadius,self.lowerRadius])tocenter[i]+max([self.upperRadius,self.lowerRadius]).Returns: Tuple containing: - xmin (float): Minimum x-coordinate.
- xmax (float): Maximum x-coordinate.
- ymin (float): Minimum y-coordinate.
- ymax (float): Maximum y-coordinate.
Return type: tuple
-
getZExtend()¶ Overwrites
pyfrp.subclasses.pyfrp_geometry.geometry.getZExtend().By default, cone geometry is set to range from
-heightto0.
-
optimalAllROI(name='', Id=0, color='b', asMaster=False, roi=None)¶ Sets optimal ROI to a
pyfrp.subclasses.pyfrp_ROI.radialSliceROIwith radiusupperRadius, centercenter, covering the whole z-range of geometry.Keyword Arguments: - name (str) – Name of new ROI.
- Id (int) – ID of new ROI.
- color (str) – Color that ROI is going to be associated with.
- asMaster (bool) – Make new ROI masterROI.
-
setHeight(h)¶ Sets cone height.
Parameters: h (float) – New height. Returns: New height. Return type: float
-
setLowerRadius(r)¶ Sets cone lower radius.
Parameters: h (float) – New lower radius. Returns: New lower radius. Return type: float
-
setUpperRadius(r)¶ Sets cone upper radius.
Parameters: h (float) – New upper radius. Returns: New upper radius. Return type: float
-
updateGeoFile(debug=False)¶ Updates .geo file of geometry.
Keyword Arguments: debug (bool) – Print debugging messages.
-
class
pyfrp.subclasses.pyfrp_geometry.custom(embryo, center, fnGeo)¶ Bases:
pyfrp.subclasses.pyfrp_geometry.geometryCustom geometry class for custom geometry configurations.
-
class
pyfrp.subclasses.pyfrp_geometry.cylinder(embryo, center, radius, height)¶ Bases:
pyfrp.subclasses.pyfrp_geometry.geometryGeometry describing a cylinder.
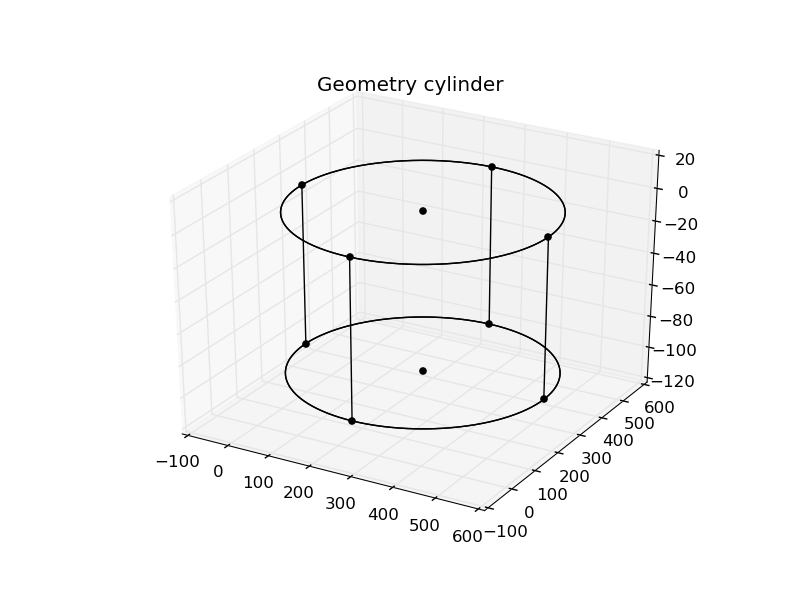
The crucial geometrical parameters are:
radius: Radius of the cylinder.height: Height of the cylinder.
-
genAsOpenscad()¶ Generates cylinder geometry as solid python object.
Useful if geometry is used to be passed to openscad.
Returns:
-
getHeight()¶ Returns cylinder height.
Returns: Height. Return type: float
-
getRadius()¶ Returns cylinder radius.
Returns: Radius. Return type: float
-
getXYExtend()¶ Overwrites
pyfrp.subclasses.pyfrp_geometry.geometry.getXYExtend().By default, cylinder geometry is set to range from
center[i]-radiustocenter[i]+radius.Returns: Tuple containing: - xmin (float): Minimum x-coordinate.
- xmax (float): Maximum x-coordinate.
- ymin (float): Minimum y-coordinate.
- ymax (float): Maximum y-coordinate.
Return type: tuple
-
getZExtend()¶ Overwrites
pyfrp.subclasses.pyfrp_geometry.geometry.getZExtend().By default, cylinder geometry is set to range from
-heightto0.
-
optimalAllROI(name='', Id=0, color='b', asMaster=False, roi=None)¶ Sets optimal ROI to a
pyfrp.subclasses.pyfrp_ROI.radialSliceROIwith radiusradius, centercenter, covering the whole z-range of geometry.Keyword Arguments: - name (str) – Name of new ROI.
- Id (int) – ID of new ROI.
- color (str) – Color that ROI is going to be associated with.
- asMaster (bool) – Make new ROI masterROI.
-
setHeight(h)¶ Sets cylinder height.
Parameters: h (float) – New height. Returns: New height. Return type: float
-
setRadius(r)¶ Sets cylinder radius.
Parameters: h (float) – New radius. Returns: New radius. Return type: float
-
updateGeoFile(debug=False)¶ Updates .geo file of geometry.
Keyword Arguments: debug (bool) – Print debugging messages.
-
class
pyfrp.subclasses.pyfrp_geometry.cylinderQuad(embryo, center, radius, height)¶ Bases:
pyfrp.subclasses.pyfrp_geometry.cylinderGeometry describing a cylinder, reduced to first quadrant.
Inherits from
cylinder. Please refer to its documentation for further details.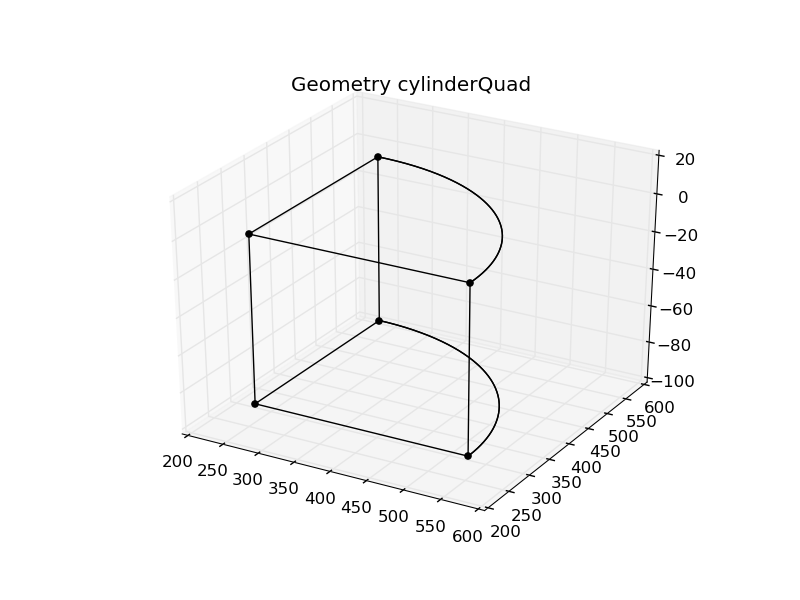
-
class
pyfrp.subclasses.pyfrp_geometry.geometry(embryo, typ, fnGeo, center)¶ Bases:
objectBasic PyFRAP geometry class.
Stores all the necessary information to describe a geometry. Comes with helpful methods for
- Centering (see
centerInImg()) - Defining optimal ROIs (see
optimalAllROI()) - Geometry file parsing (see
readGeoFile()) - Geometry plotting (see
plotGeometry())
Parameters: - embryo (pyfrp.subclasses.pyfrp_emrbyo.embryo) – Embryo class that geometry belongs to.
- typ (str) – Type of geometry.
- fnGeo (str) – Path to gmsh .geo file describing the geometry.
- center (numpy.ndarray) – Center of geometry.
-
center2Mid(updateInFile=True)¶ Sets geometry center to center of image.
Uses
embryo.dataResPxto calculate image center.Note
The geometry
centerattribute is then also set in .geo file ifupdateInFileis selected.Keyword Arguments: updateInFile (bool) – Update center in .geo file. Returns: New center. Return type: numpy.ndarray
-
centerInImg()¶ Sets geometry center to center of image, updates .geo file and if avaialable remeshes.
Uses
embryo.dataResPxto calculate image center.Note
The geometry
centerattribute is then also set in .geo file.Returns: New center. Return type: numpy.ndarray
-
getCenter()¶ Returns geometry center.
Returns: New center. Return type: numpy.ndarray
-
getEmbryo()¶ Returns
pyfrp.subclasses.pyfrp_embryo.embryoinstance that geometry belongs to.
-
getExtend()¶ Returns extend in x/y/z-direction.
Will call
getXYExtend()andgetZExtend()for it.Returns: Tuple containing: - xmin (float): Minimum x-coordinate.
- xmax (float): Maximum x-coordinate.
- ymin (float): Minimum y-coordinate.
- ymax (float): Maximum y-coordinate.
- zmin (float): Minimum z-coordinate.
- zmax (float): Maximum z-coordinate.
Return type: tuple
-
getFnGeo()¶ Returns path to .geo file.
Returns: Path to file. Return type: str
-
getMaxGeoID()¶ Returns maximum ID over all elements in .geo file.
Sell also
readGeoFile()andpyfrp.modules.pyfrp_gmsh_geometry.domain.getAllMaxID().Returns: Maximum ID. Return type: int
-
getTyp()¶ Returns type of geometry.
Returns: Type of geometry. Return type: str
-
getXYExtend()¶ Returns extend in x/y-direction by reading out vertices from .geo file and returning maximum and minimum x/y-coordinates.
Returns: Tuple containing: - xmin (float): Minimum x-coordinate.
- xmax (float): Maximum x-coordinate.
- ymin (float): Minimum y-coordinate.
- ymax (float): Maximum y-coordinate.
Return type: tuple
-
getZExtend()¶ Returns extend in z-direction by reading out vertices from .geo file and returning maximum and minimum z-coordinates.
Returns: Tuple containing: - zmin (float): Minimum z-coordinate.
- zmax (float): Maximum z-coordinate.
Return type: tuple
-
moveGeoFile(fn)¶ Moves geometry file to different directory.
Note
This function actually copies the file so that files in
pyfrp/meshfiles/will not be removed.Will update
geometry.fnGeoto the new file location.Note
If existent, will also copy the corresponding mesh file.
Parameters: fn (str) – Path of folder where geo file is supposed to go. Returns: New file location. Return type: str
-
plotGeometry(ax=None, color='k', ann=False)¶ Plots geometry in 3D.
Reads the .geo file and parses it into a
pyfrp.modules.pyfrp_gmsh_geometry.domaininstance. Then draws the domain.If no axes are given via
ax, will create new matplotlib axes.Keyword Arguments: - ax (matplotlib.axes) – Axes to draw in.
- color (str) – Color of plot.
- ann (bool) – Show annotations.
Returns: Axes used for plotting.
Return type: matplotlib.axes
-
printDetails()¶ Prints out all details of geometry object.
-
readGeoFile()¶ Reads the .geo file and parses it into a
pyfrp.modules.pyfrp_gmsh_geometry.domaininstance.Returns: Domain containing geometry. Return type: pyfrp.modules.pyfrp_gmsh_geometry.domain
-
render2Openscad(fn=None, segments=48)¶ Generates .scad file for the geometry.
Note
If
fn=None, then will use the same filename and path as .geo file.Keyword Arguments: - fn (str) – Output filename.
- segments (int) – Number of segments used for convex hull of surface.
-
render2Stl(fn=None, segments=48)¶ Generates .stl file for the geometry.
Note
If
fn=None, then will use the same filename and path as .geo file.Keyword Arguments: - fn (str) – Output filename.
- segments (int) – Number of segments used for convex hull of surface.
-
setAllROI(name='All', makeNew=False, updateIdxs=False)¶ Tries to set the optimal All ROI for a specific geometry.
Keyword Arguments: - name (str) – Name of All ROI to look for.
- makeNew (bool) – Generate a new All ROI.
- updateIdxs (bool) – Update indices of new ROI.
Returns: New ROI instance.
Return type:
-
setCenter(c, updateInFile=True)¶ Sets geometry center.
Note
The geometry
centerattribute is then also set in .geo file ifupdateInFileis selected.Parameters: c (numpy.ndarray) – New center [x,y].Keyword Arguments: updateInFile (bool) – Update center in .geo file. Returns: New center. Return type: numpy.ndarray
-
setFnGeo(fn)¶ Sets path to .geo file.
Parameters: fn (str) – Path to file. Returns: Path to file. Return type: str
- Centering (see
-
class
pyfrp.subclasses.pyfrp_geometry.xenopusBall(embryo, center, imagingRadius)¶ Bases:
pyfrp.subclasses.pyfrp_geometry.geometryGeometry describing a ball.
This geometry is similar to a xenopus in stage 7-10, see http://www.xenbase.org/anatomy/alldev.do.
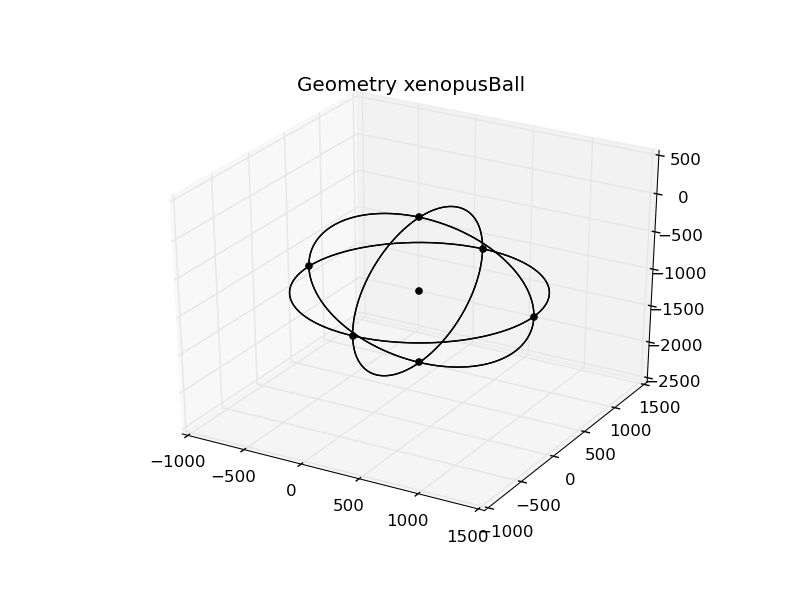
The crucial geometrical parameters are:
radius: Radius of the ball.
PyFRAP automatically computes these parameters given
imagingRadius: Radius of embryo at imaging depth.imagingHeight: Imaging depth.
For details of this computations, see
computeBall().-
computeBall()¶ Computes ball geometry from
imagingRadiusandimagingHeight.Computes ball geometry as follows:
\[r=\frac{r_{\mathrm{imaging}}^2+h_{\mathrm{imaging}}^2}{-2 h_{\mathrm{imaging}}},\]where \(r\) is the
radius, \(h_{\mathrm{imaging}}\) is theimagingHeightand \(r_{\mathrm{imaging}}\) is theimagingRadius.The center of the ball is set to
[center[0],center[1],-radius](Only in .geo file).
-
getImagingHeight(h)¶ Returns imaging height.
-
getImagingRadius(r)¶ Returns imaging radius.
-
getRadius()¶ Returns ball radius.
-
getXYExtend()¶ Overwrites
pyfrp.subclasses.pyfrp_geometry.geometry.getXYExtend().By default, ball geometry is set to range from
center[i]-radiustocenter[i]+radius.Returns: Tuple containing: - xmin (float): Minimum x-coordinate.
- xmax (float): Maximum x-coordinate.
- ymin (float): Minimum y-coordinate.
- ymax (float): Maximum y-coordinate.
Return type: tuple
-
getZExtend()¶ Overwrites
pyfrp.subclasses.pyfrp_geometry.geometry.getZExtend().By default, ball geometry is set to range from
-imagingRadiusto0.
-
optimalAllROI(name='', Id=0, color='b', asMaster=False, roi=None)¶ Sets optimal ROI to a
pyfrp.subclasses.pyfrp_ROI.radialSliceROIwith radiusradius, centercenter, covering the whole z-range of geometry.Keyword Arguments: - name (str) – Name of new ROI.
- Id (int) – ID of new ROI.
- color (str) – Color that ROI is going to be associated with.
- asMaster (bool) – Make new ROI masterROI.
-
restoreDefault()¶ Restores default values.
Only default value of ball geometry is that
imagingHeightis set to be equal tosliceHeightPxofembryo.
-
setImagingHeight(h)¶ Sets imaging height and updates ball geometry.
Parameters: h (float) – New height. Returns: New height. Return type: float
-
setImagingRadius(r)¶ Sets imaging radius and updates ball geometry.
Parameters: h (float) – New radius. Returns: New radius. Return type: float
-
updateGeoFile(debug=False)¶ Updates .geo file of geometry.
Keyword Arguments: debug (bool) – Print debugging messages.
-
class
pyfrp.subclasses.pyfrp_geometry.xenopusBallQuad(embryo, center, imagingRadius)¶ Bases:
pyfrp.subclasses.pyfrp_geometry.xenopusBallGeometry describing a ball, reduced to first quadrant.
Inherits from
xenopusBall. Please refer to its documentation for further details.Warning
meshfiles/quad_ball.geodoes not exist yet.
-
class
pyfrp.subclasses.pyfrp_geometry.zebrafishDomeStage(embryo, center, imagingRadius, radiusScale=1.1)¶ Bases:
pyfrp.subclasses.pyfrp_geometry.geometryGeometry describing a zebrafish embryo in dome stage.
For information about zebrafish stages, see http://onlinelibrary.wiley.com/doi/10.1002/aja.1002030302/abstract;jsessionid=1EAD19FE5563DAA94E3C22C5D5BEEC85.f01t03.
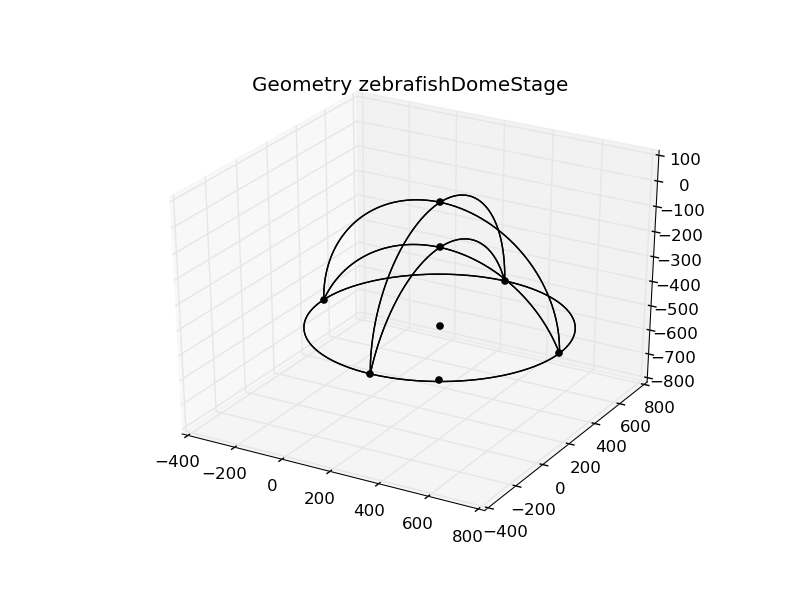
The zebrafish geometry is basically described by two half-balls with different radii piled on top of each other. The crucial geometrical parameters are:
outerRadius: Radius of the outer ball.innerRadius: Radius of the inner ball.centerDist: Distance between the centers of the two balls.
PyFRAP automatically computes these parameters given
imagingRadius: Radius of embryo at imaging depth.imagingHeight: Imaging depth.radiusScale: Scaling factor between radii.
For details of this computations, see
computeDome().-
computeDome()¶ Updates zebrafish geometry.
Computes zebrafish geometry as follows:
\[\begin{split}r_{\mathrm{outer}}=\frac{r_{\mathrm{imaging}}^2+h_{\mathrm{imaging}}^2}{-2 h_{\mathrm{imaging}}},\\ r_{\mathrm{inner}}=s_{\mathrm{radius}}r_{\mathrm{outer}},\\ d_{\mathrm{center}}=\sqrt{r_{\mathrm{inner}}^2-r_{\mathrm{outer}}^2},\end{split}\]where \(r_{\mathrm{outer}}\) is the
outerRadius, \(r_{\mathrm{inner}}\) is theinnerRadius, \(h_{\mathrm{imaging}}\) is theimagingHeightand \(r_{\mathrm{imaging}}\) is theimagingRadius.Returns: Tuple containing: - innerRadius (float): New inner radius.
- centerDist (float): New distance between centers.
Return type: tuple
-
genAsOpenscad()¶ Generates zebrafish geometry as solid python object.
Useful if geometry is used to be passed to openscad.
Returns:
-
getImagingHeight()¶ Returns imaging height.
-
getImagingRadius()¶ Returns imaging radius.
-
getInnerRadius()¶ Returns inner radius.
-
getOuterRadius()¶ Returns outer radius.
-
getRadiusScale()¶ Returns radius scaling factor.
-
getVolume()¶ Returns volume of geometry.
Volume is computed by:
\[V_{dome}=\frac{\pi}{6}(4 r_{\mathrm{outer}}^3 - (d_{\mathrm{center}}-r_{\mathrm{inner}})(3r_{\mathrm{outer}}^2+(d_{\mathrm{center}}-r_{\mathrm{inner}})^2))\]Returns: Volume of zebrafish dome. Return type: float
-
getXYExtend()¶ Overwrites
pyfrp.subclasses.pyfrp_geometry.geometry.getXYExtend().By default, zebrafish geometry is set to range from
center[i]-outerRadiustocenter[i]+outerRadius.Returns: Tuple containing: - xmin (float): Minimum x-coordinate.
- xmax (float): Maximum x-coordinate.
- ymin (float): Minimum y-coordinate.
- ymax (float): Maximum y-coordinate.
Return type: tuple
-
getZExtend()¶ Overwrites
pyfrp.subclasses.pyfrp_geometry.geometry.getZExtend().By default, zebrafish geometry is set to range from
-outerRadiusto0.
-
optimalAllROI(name='', Id=0, color='b', asMaster=False)¶ Sets optimal ROI to a
pyfrp.subclasses.pyfrp_ROI.radialSliceROIwith radiusouterRadius, centercenter, covering the whole z-range of geometry.Keyword Arguments: - name (str) – Name of new ROI.
- Id (int) – ID of new ROI.
- color (str) – Color that ROI is going to be associated with.
- asMaster (bool) – Make new ROI masterROI.
-
restoreDefault()¶ Restores default values.
Only default value of zebrafish geometry is that
imagingHeightis set to be equal tosliceHeightPxofembryo.
-
setImagingHeight(h)¶ Sets imaging height and updates zebrafish geometry.
Parameters: h (float) – New height. Returns: New height. Return type: float
-
setImagingRadius(r)¶ Sets imaging radius and updates zebrafish geometry.
Parameters: r (float) – New radius. Returns: New radius. Return type: float
-
setOuterRadius(r)¶ Sets outer radius and updates zebrafish geometry.
Parameters: r (float) – New radius. Returns: New radius. Return type: float
-
setRadiusScale(s)¶ Sets scaling factor between outer and inner radius and updates zebrafish geometry.
Parameters: s (float) – New scaling factor. Returns: New scaling factor. Return type: float
-
updateGeoFile(debug=False)¶ Updates .geo file of geometry.
Keyword Arguments: debug (bool) – Print debugging messages.
-
class
pyfrp.subclasses.pyfrp_geometry.zebrafishDomeStageQuad(embryo, center, imagingRadius, radiusScale=1.1)¶ Bases:
pyfrp.subclasses.pyfrp_geometry.zebrafishDomeStageGeometry describing a zebrafish embryo in dome stage, reduced to first quadrant.
Inherits from
zebrafishDomeStage. Please refer to its documentation for further details.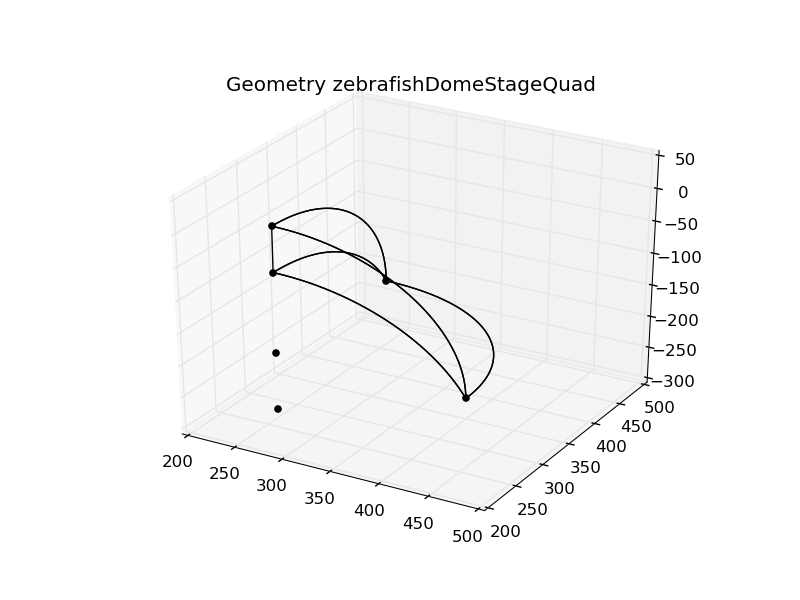
pyfrp.subclasses.pyfrp_mesh module
Essential PyFRAP module containing mesh class.
-
class
pyfrp.subclasses.pyfrp_mesh.mesh(simulation)¶ Bases:
objectMesh class for PyFRAP.
The mesh class stores all information about location and creation of the mesh used for a simulation. It is directly associated with the
pyfrp.subclasses.pyfrp_simulation.simulationobject that uses it.Meshes can either be created via running Gmsh onto the .geo file of the
pyfrp.subclasses.pyfrp_geometry.geometry, or by running Gmsh internally from FiPy using some predefined functions (limited geometry support). See alsogenMesh().The most important attributes are:
mesh: The actual mesh as afipy.GmshImporter3Dobject.fromFile: Flag that controls if mesh should be created from .geo file or not.volSizePx: Mesh element size in px.
Besides mesh storage and creation, the mesh class contains useful functions such as:
- Mesh refinement, see
refine(),addBoxField()andforceMinMeshDensityInROI(). - Information output, see
printStats(). - Plotting, see
plotMesh()andplotDensity().
Parameters: simulation (pyfrp.subclasses.pyfrp_simulation.simulation) – Simulation object. -
addBoundaryLayerAroundROI(roi, fnOut=None, segments=48, simplify=True, iterations=3, triangIterations=2, fixSurfaces=True, debug=False, volSizePx=None, volSizeLayer=10, thickness=15.0, cleanUp=True, approxBySpline=True, angleThresh=0.95, faces='all', onlyAbs=True)¶ Adds boundary layer around ROI to the mesh.
Does this by:
- Generating a stl file describing ROI, see also
pyfrp.subclasses.pyfrp_ROI.ROI.render2StlInGeometry(). - Read in stl file as new
pyfrp.modules.pyfrp_gmsh_geometry.domainviapyfrp.modules.pyfrp_gmsh_IO_module.readStlFile(). - Simplify new geometry via
pyfrp.modules.pyfrp_gmsh_geometry.domain.simplifySurfaces(). - Extracting selected surfaces via
pyfrp.modules.pyfrp_gmsh_geometry.gmshElement.extract(). - If selected, surface boundaries are approximated into splines via
pyfrp.modules.pyfrp_gmsh_geometry.gmshElement.extract(). - Reading in geometry’s .geo file via
pyfrp.sublcasses.pyfrp_geometry.geometry.readGeoFile(). - Merging ROI geometry into main geometry via
pyfrp.modules.pyfrp_gmsh_geometry.domain.merge(). - Adding a boundary layer mesh via
pyfrp.modules.pyfrp_gmsh_geometry.domain.addBoundaryLayerField(). - Adding all surfaces of ROI’s domain to boundary layer, see
pyfrp.modules.pyfrp_gmsh_geometry.boundaryLayerField.addFaceListByID(). - Writing new .geo file.
- Setting new .geo file as
fnGeo. - Running
genMesh(). - Clean up .stl and .scad files that are not needed anymore.
Note
volSizeLayeronly allows a single definition of mesh size in layer. Note that thepyfrp.modules.pyfrp_gmsh_geometry.boundaryLayerFieldclass allows different mesh sizes normal and along surfaces. For more information, see its documentation.Note
If no
fnOutis given, will save a new .geo file in same folder as originalfnGeowith subfix:fnGeo_roiName_BL.geo.Note
pyfrp.modules.pyfrp_gmsh_geometry.domain.simplifySurfaces()is not a simple procedure, we recommend reading its documentation.If
volSizePxis given, will overwrite mesh’svolSizePxand set it globally at all nodes.Parameters: roi (pyfrp.subclasses.pyfrp_ROI.ROI) – An ROI.
Keyword Arguments: - fnOut (str) – Path to new .geo file.
- segments (int) – Number of segments used for convex hull of surface.
- simplify (bool) – Simplify surfaces of stl file.
- iterations (int) – Number of iterations used for simplification.
- triangIterations (int) – Number of iterations used for subdivision of surfaces.
- addPoints (bool) – Allow adding points inside surface triangles.
- fixSurfaces (bool) – Allow fixing of surfaces, making sure they are coherent with Gmsh requirements.
- debug (bool) – Print debugging messages.
- volSizePx (float) – Global mesh density.
- volSizeLayer (float) – Boundary layer mesh size.
- thickness (float) – Thickness of boundary layer.
- cleanUp (bool) – Clean up temporary files when finished.
- approxBySpline (bool) – Approximate curvatures by spline.
- angleThresh (float) – Threshold angle under which loops are summarized.
- faces (list) – List of faces.
- onlyAbs (bool) – Take absolute value of faces into account.
Returns: Path to new .geo file.
Return type: str
- Generating a stl file describing ROI, see also
-
addBoxField(volSizeIn, rangeX, rangeY, rangeZ, newFile=True, fnAppendix='_box', comment='newField', run=False, fnOut=None)¶ Adds box field to mesh.
Box fields allow to refine certain areas of the mesh, see also http://gmsh.info/doc/texinfo/gmsh.html#Specifying-mesh-element-sizes .
Note
Will keep
volSizePxas volSize outside of the box.Note
If
fnOutis not specified, will do the following:- If
newFile=True, will create new file with pathfnGeo+/field/custom/fnGeo+fnAppendix.geo - Else writes into
fnGeo.
Parameters: - volSizeIn (float) – volSize in px inside the box.
- rangeX (list) – Range of box field in x-direction given as
[minVal,maxVal]. - rangeY (list) – Range of box field in y-direction given as
[minVal,maxVal]. - rangeZ (list) – Range of box field in z-direction given as
[minVal,maxVal]. - newFile (bool) – Write new mesh into a new .geo file.
- fnAppendix (str) – Append this to new file name.
- comment (str) – Comment in .geo file before definition of box field.
- run (bool) – Run Gmsh on new .geo file afterwards.
- fnOut (str) – Path to output geo file.
Returns: Path to new .geo file.
Return type: str
- If
-
calcAllTetSidelenghts()¶ Calculates sidelengths of all tetrahedra.
See also
pyfrp.modules.pyfrp_integration_module.calcTetSidelengths().Returns: List of all sidelengths. Return type: list
-
forceMinMeshDensityInROI(ROI, density, stepPercentage=0.1, debug=False, findIdxs=True, method='refine', maxCells=100000)¶ Forces global mensh density such that a certain density is reached in a given ROI.
Tries to achive a mesh density
densityinROIby globally refining mesh either through decreasingvolSizePxbystepPercentagepercent (method=volSize), or by using Gmsh’s-refineoption (method=refine). If maximum number of cells is exceeded, will use the last mesh that did not exceedmaxCells.Parameters: - ROI (pyfrp.subclasses.pyfrp_ROI.ROI) – ROI object.
- density (float) – Desired density.
Keyword Arguments: - stepPercentage (float) – If method is
volSize, percentage ofvolSizedecrease. - method (str) – Refinement method (
refine/volSize). - maxCells (int) – Total maximum number of mesh cells allowed.
- findIdxs (bool) – Find ROI indices after refinement.
- debug (bool) – Print debugging messages.
Returns: New
volSizePxReturn type: float
-
genMesh(fnOut=None, debug=False)¶ Main mesh generation function.
Note
If
fnOut=None, will usegeometry.fnGeo.Note
If
fromFile=True, will generate from .geo file running gmsh directly on the file. If not, will try to run hard coded FiPy version for mesh generation viarunFiPyMeshGenerator().Keyword Arguments: - fnOut (str) – Output filepath for meshfile.
- debug (bool) – Print debugging messages.
Returns: Gmsh mesh object.
Return type: fipy.GmshImporter3D
-
getFnMesh()¶ Returns the filepath of meshfile.
-
getMaxNodeDistance()¶ Returns maximum node distance in x/y/z direction.
Returns: Tuple containing: - dmaxX (float): Maximum distance in x-direction
- dmaxY (float): Maximum distance in y-direction
- dmaxZ (float): Maximum distance in z-direction
Return type: tuple
-
getMesh()¶ Returns mesh that is used for simulation.
Returns: Gmsh mesh object. Return type: fipy.GmshImporter3D
-
getNNodes()¶ Returns number of nodes in mesh.
If no mesh has been generated yet, will return 0.
Returns: Number of nodes. Return type: int
-
getSimulation()¶ Returns
pyfrp.subclasses.pyfrp_simulationthat mesh belongs to.Returns: Simulation object. Return type: pyfrp.subclasses.pyfrp_simulation
-
getVolSizePx()¶ Returns mesh volSize in px.
Returns: VolSize. Return type: float
-
importMeshFromFile(fn)¶ Imports mesh from a Gmsh .msh file.
See also http://www.ctcms.nist.gov/fipy/fipy/generated/fipy.meshes.html.
Parameters: fn (str) – Filepath to meshfile. Returns: Gmsh mesh object. Return type: fipy.GmshImporter3D
-
importVTKFile(fnVTK='', sub=False)¶ Imports a .vtk file into a vtk renderer.
If
fnVTKis not given, will generate .vtk file from meshfile stored infnMeshusingwriteVTKFile().If
sub==True, will start a seperate subprocess and submitpyfrp_meshIO_script.pyto it. This can be sometimes useful, since PyFRAP sometimes tends to crash otherwise.Note
This function imports vtk. vtk is only necessary in a few functions, hence only imported when needed. This should make PyFRAP more portable.
Keyword Arguments: - fnVTK (str) – Path to input vtk file.
- sub (bool) – Subprocess flag.
Returns: Renderer object.
Return type: vtk.vtkRenderer
-
plotCellCenters(ax=None, proj=None, color='k', indicateHeight=False, s=5.0, roi=None)¶ Plots location of cell centers of mesh.
Note
If no
axare given will create new ones.If
proj=[3d], will create 3D scatter plot, otherwise project cell centers in 2D.Example:
Create figure
>>> fig,axes = pyfrp_plot_module.makeSubplot([2,2],titles=['2D','2D indicate','3D','3D indicate'],proj=[None,None,'3d','3d'])
Plot in 4 different ways
>>> mesh.plotCellCenters(ax=axes[0],s=1.)
>>> mesh.plotCellCenters(ax=axes[1],indicateHeight=True,s=5.)
>>> mesh.plotCellCenters(ax=axes[2],s=3.)
>>> mesh.plotCellCenters(ax=axes[3],indicateHeight=True,s=3.)
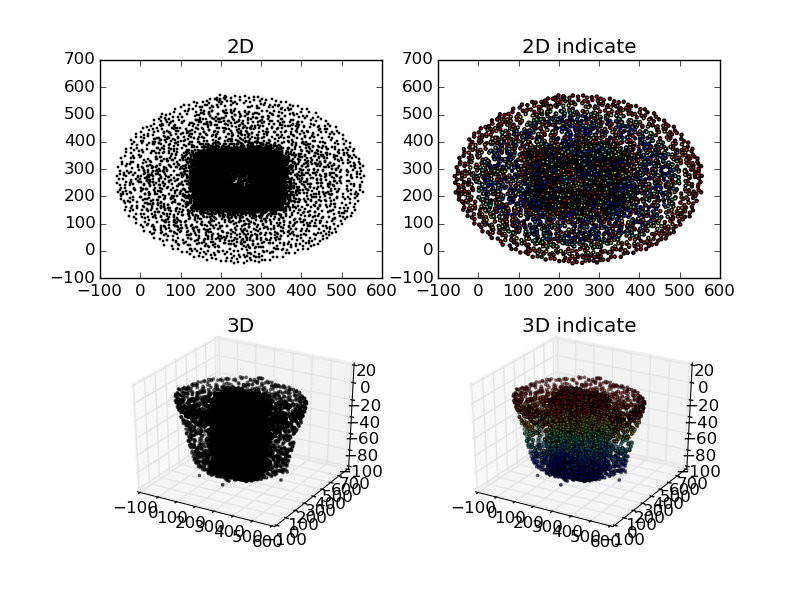
Keyword Arguments: - ax (matplotlib.axes) – Axes to plot in.
- proj (list) – List of projections.
- color (str) – Color of mesh nodes.
- indicateHeight (bool) – Indicate height by color.
- s (float) – Size of marker.
- roi (pyfrp.subclasses.pyfrp_ROI) – ROI.
Returns: Matplotlib axes.
Return type: matplotlib.axes
-
plotDensity(axes=None, hist=True, bins=100, color='b')¶ Plots the mesh density in x/y/z-direction.
hist=Trueis recommended, since otherwise plots generally appear fairly noisy.Note
If no
axesare given or they do not have the necessary size, will create new ones.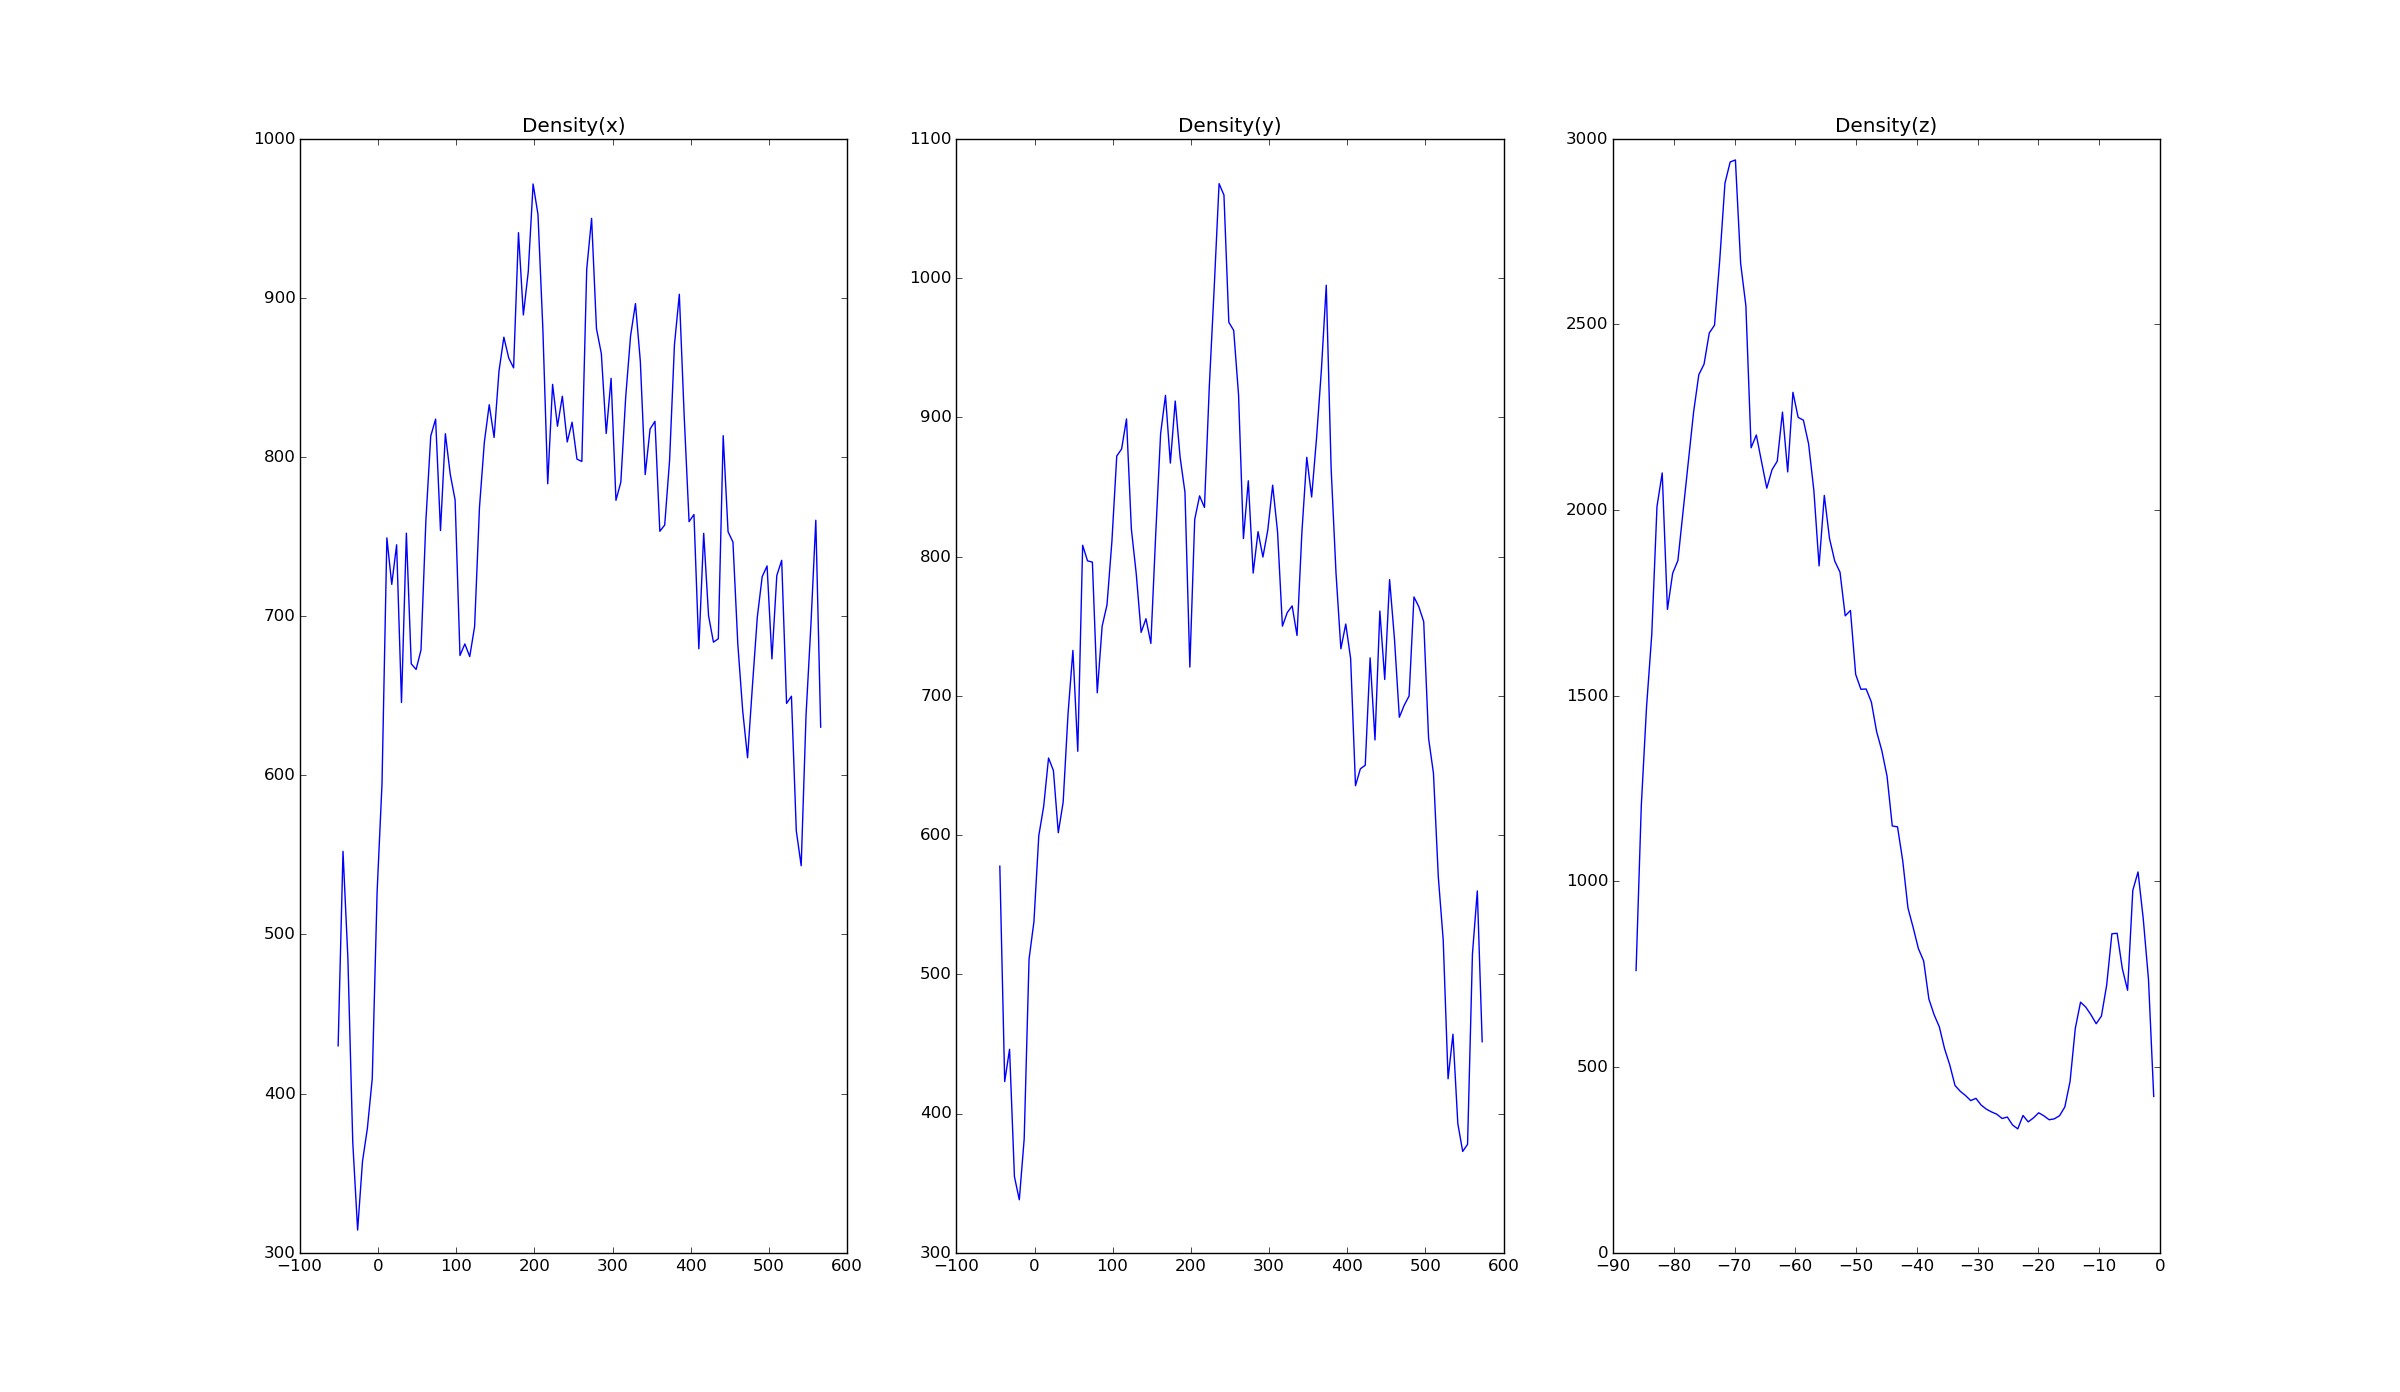
Keyword Arguments: - axes (list) – List of
matplotlib.axes. - hist (bool) – Summarize densities in bins.
- bins (int) – Number of bins used for hist.
- color (str) – Color of plot.
Returns: List of
matplotlib.axes.Return type: list
- axes (list) – List of
-
plotMesh(fnVTK='')¶ Plots the mesh using VTK.
If
fnVTKis not given, will generate .vtk file from meshfile stored infnMeshusingwriteVTKFile().Note
This function imports vtk. vtk is only necessary in a few functions, hence only imported when needed. This should make PyFRAP more portable.
Keyword Arguments: fnVTK (str) – Path to input vtk file. Returns: RenderWindow object. Return type: vtk.vtkRenderWindow
-
printAllAttr()¶ Prints out all attributes of mesh object.
-
printStats(tetLenghts=False)¶ Prints out statistics of mesh.
Also calculates all tetraheder lengths if
tetLenghtsis selected. This might take some time depending on mesh size.Keyword Arguments: tetLenghts (bool) – Also calculate and print out tetrahedra sidelengths.
-
refine(debug=False)¶ Refines mesh by splitting.
See also http://gmsh.info/doc/texinfo/gmsh.html .
Keyword Arguments: debug (bool) – Print debugging messages.
-
restoreDefaults()¶ Restores default parameters of mesh.
Default parameters are:
mesh.geometry=mesh.simulation.embryo.geometrymesh.fromFile=Truemesh.volSizePx=20mesh.fnMesh=""
-
runFiPyMeshGenerator(typ)¶ Runs gmsh on the via FiPy internally defined meshes.
Available meshes:
- cylinder
- zebrafishDomeStage
- xenopusBall
Note
Any refinement method will not work if mesh is created this way.
Parameters: typ (str) – Type of mesh to be created (see list above). Returns: Gmsh mesh object. Return type: fipy.GmshImporter3D
-
saveMeshToImg(fnOut, fnVTK='', renderer=None, magnification=10, show=True)¶ Saves mesh to image file.
Supported extensions are:
- ‘.ps’ (PostScript)
- ‘.eps’ (Encapsualted PostScript)
- ‘.pdf’ (Portable Document Format)
- ‘.jpg’ (Joint Photographic Experts Group)
- ‘.png’ (Portable Network Graphics)
- ‘.pnm’ (Portable Any Map)
- ‘.tif’ (Tagged Image File Format)
- ‘.bmp’ (Bitmap Image)
If
fnVTKis not given, will generate .vtk file from meshfile stored infnMeshusingwriteVTKFile().If no
rendereris given, will create one usingplotMesh().Note
This function imports vtk. vtk is only necessary in a few functions, hence only imported when needed. This should make PyFRAP more portable.
Some code taken from http://www.programcreek.com/python/example/23102/vtk.vtkGL2PSExporter .
Parameters: fnOut (str) – Path to output file.
Keyword Arguments: - fnVTK (str) – Path to input vtk file.
- renderer (vtk.vtkOpenGLRenderer) – Renderer.
- magnification (int) – Degree of magnification.
- show (bool) – Show vtk render window.
Returns: Exporter object.
Return type: vtk.vtkExporter
-
saveMeshToPS(fnOut, fnVTK='', renderer=None)¶ Saves mesh to postscript file.
Supported extensions are:
- ‘.ps’ (PostScript)
- ‘.eps’ (Encapsualted PostScript)
- ‘.pdf’ (Portable Document Format)
- ‘.tex’ (LaTeX)
- ‘.svg’ (Scalable Vector Graphics)
If
fnVTKis not given, will generate .vtk file from meshfile stored infnMeshusingwriteVTKFile().If no
rendereris given, will create one usingplotMesh().Note
This function imports vtk. vtk is only necessary in a few functions, hence only imported when needed. This should make PyFRAP more portable.
Some code taken from http://www.programcreek.com/python/example/23102/vtk.vtkGL2PSExporter .
Parameters: fnOut (str) – Path to output file.
Keyword Arguments: - fnVTK (str) – Path to input vtk file.
- renderer (vtk.vtkOpenGLRenderer) – Renderer.
- magnification (int) – Degree of magnification.
Returns: Exporter object.
Return type: vtk.vtkGL2PSExporter
-
setFnMesh(fn)¶ Sets the filepath of meshfile.
Imports the new mesh right away using
importMeshFromFile().
-
setFromFile(v)¶ Sets flag if mesh is supposed to be created from file (recommended) or from internally defined mesh creation method.
Parameters: v (bool) – New flag value. Returns: New flag value. Return type: bool
-
setMesh(m)¶ Sets
meshattribute to a new mesh.Parameters: m (fipy.GmshImporter3D) – New mesh. Returns: Gmsh mesh object. Return type: fipy.GmshImporter3D
-
setVolSizePx(v, remesh=True, fnOut=None)¶ Sets volSize of mesh in px.
Note
If
fnOut=None, then eitherfnMeshwill be used, or, iffnMeshis not set yet, will usegeometry.fnGeo.Parameters: v (float) – New volSize.
Keyword Arguments: - remesh (bool) – Generate mesh with new volSize.
- fnOut (str) – Output filepath for meshfile.
Returns: New volSize.
Return type: float
-
updateGeoFile(debug=False)¶ Updates geometry file by writing new
volSizePxintoembryo.geometry.fnGeo.Keyword Arguments: debug (bool) – Print debugging messages. Returns: Path to ouput meshfile. Return type: str
-
writeVTKFile(fn='', sub=False)¶ Writes mesh into vtk file.
Uses meshIO (https://github.com/nschloe/meshio), to convert the mesh saved in
fnMeshto a .vtk file.If
sub==True, will start a seperate subprocess and submitpyfrp_meshIO_script.pyto it. This can be sometimes useful, since PyFRAP sometimes tends to crash otherwise.If no output path is given via
fn, will use same path asfnMesh.Note
meshIO only gets imported inside this function, making PyFRAP running even without the package installed. However, this feature will only run with meshIO.
Keyword Arguments: - fn (str) – Optional output path.
- sub (bool) – Subprocess flag.
Returns: Used output path.
Return type: str
pyfrp.subclasses.pyfrp_molecule module
-
class
pyfrp.subclasses.pyfrp_molecule.molecule(name)¶ Molecule class, collecting information about a series of FRAP experiments.
The main purpose of the molecule class is to gather and summarize multiple FRAP experiments. Embryo objects are stored in a
embryoslist. From those embryo objects, fit objects can be added to theselFitslist to then be summarized to calculate measurement statistics. Fits can be forced to overlap in a set of parameters defined incrucialParameters.-
addEmbryo(embryo)¶ Appends embryo object to
embryoslist.Parameters: embryo (pyfrp.subclasses.pyfrp_embryo) – Embryo to append. Returns: Updated pyfrp.subclasses.pyfrp_molecule.embryos list Return type: list
-
checkEmbryoNames()¶ Check if all embryos in
embryoslist have different names.Returns: True if all different, False else. Return type: bool
-
clearAllEmbryos()¶ Replaces all attribute values of each embryo in embryos list with
None, exceptname.Useful if embryos are seperated and molecule file needs to be compressed.
Note
Embryos should have all different names, so there will not be any missassignment when reimporting embryo files.
Returns: True if success, False else. Return type: bool
-
extractEmbryos2Files(fn='', copyMeshFiles=True, debug=False)¶ Extracts embryos in
embryoslist into seperate pickled files.Note
Will create folder
fnif non-existent. Iffnis not specified, will assumefn='embryoFiles/'.Keyword Arguments: - fn (str) – Path of folder where to save embryo files.
- copyMeshFiles (bool) – Copy meshfiles to embryo file destination.
- debug (bool) – Print out debugging messages.
Returns: True if success, False else.
Return type: bool
-
getEmbryoByName(s)¶ Returns embryo with name
sfromembryoslist, otherwiseFalse.
-
getName()
-
newEmbryo(name)¶ Creates new embryo and appends it to
embryoslist.Parameters: name (str) – Name of new embryo. Returns: New embryo object. Return type: pyfrp.subclasses.pyfrp_embryo
-
printResults()¶ Prints results summarized in
pyfrp.subclasses.pyfrp_molecule.sumUpResults().
-
removeEmbryo(embryo)¶ Removes embryo object from
embryoslist.Parameters: embryo (pyfrp.subclasses.pyfrp_embryo) – Embryo object. Returns: Updated pyfrp.subclasses.pyfrp_molecule.embryos list Return type: list
-
replaceEmbryo(embryo, name='')¶ Replaces embryo with same name that
embryoin molecule’sembryoslist.If no embryo with the same name exists, will simply add embryo. If
nameis given, will try to replace embryo with namenameinembryoslist.Parameters: embryo (pyfrp.subclasses.pyfrp_embryo) – New embryo to be inserted. Keyword Arguments: name (str) – Optional name of embryo embryo to be replaced. Returns: True if anything was replaced, False if anything was appended. Return type: bool
-
save(fn=None)¶ Saves molecule to pickle file.
Note
If
fnis not specified, will assumefn=self.name.Keyword Arguments: fn (str) – Molecule file name. Returns: Filename of molecule file. Return type: str
-
saveExtract(fn=None, copyMeshFiles=True, debug=False)¶ Saves molecule to pickle file in compressed version by doing:
- Extracts embryos in
embryoslist into seperate pickled files. - Clears all attributes of embryo objects
- Saves molecule file
This function is really useful if molecule file size gets out-of-hand.
Note
Embryo files will be saved in path/to/moculefile/moleculename/ .
Note
If
fnis not specified, will assumefn=self.name.Keyword Arguments: - fn (str) – Molecule file name.
- copyMeshFiles (bool) – Copy meshfiles to embryo file destination.
- debug (bool) – Print out debugging messages.
Returns: True if success, False else.
Return type: bool
- Extracts embryos in
-
setName(n)
-
sumUpResults(sameSettings=False)¶ Sums up results from all fits in
selFitslist.Keyword Arguments: sameSettings (bool) – Fits must overlap in parameters defined in crucialParameters.Returns: True if success, False else. Return type: bool
-
updateVersion()¶ Updates molecule file to current version, making sure that it possesses all attributes.
Creates a new molecule object and compares
selfwith the new molecule file. If the new molecule object has a attribute thatselfdoes not have, will add attribute with default value from the new molecle file.Note
Will also update all subobject, making sure that embryo and fit objects are up-to-date.
Returns: selfReturn type: pyfrp.subclasses.pyfrp_molecule
-
pyfrp.subclasses.pyfrp_simulation module
-
class
pyfrp.subclasses.pyfrp_simulation.simulation(embryo)¶ Bases:
objectPyFRAP simulation class.
Stores all important properties about how FRAP simulation is performed, such as:
-
compareICInterpolation(axes=None, roi=None)¶ Shows initial image, its interpolation, the resulting initial condition and its interpolation back onto an image.
See also
showICimg(),showInterpolatedICImg(),showIC(),showInterpolatedIC().Will create new axes if necessary.
Warning
Some images might be flipped due to plotting functions. Will be fixed in future version.
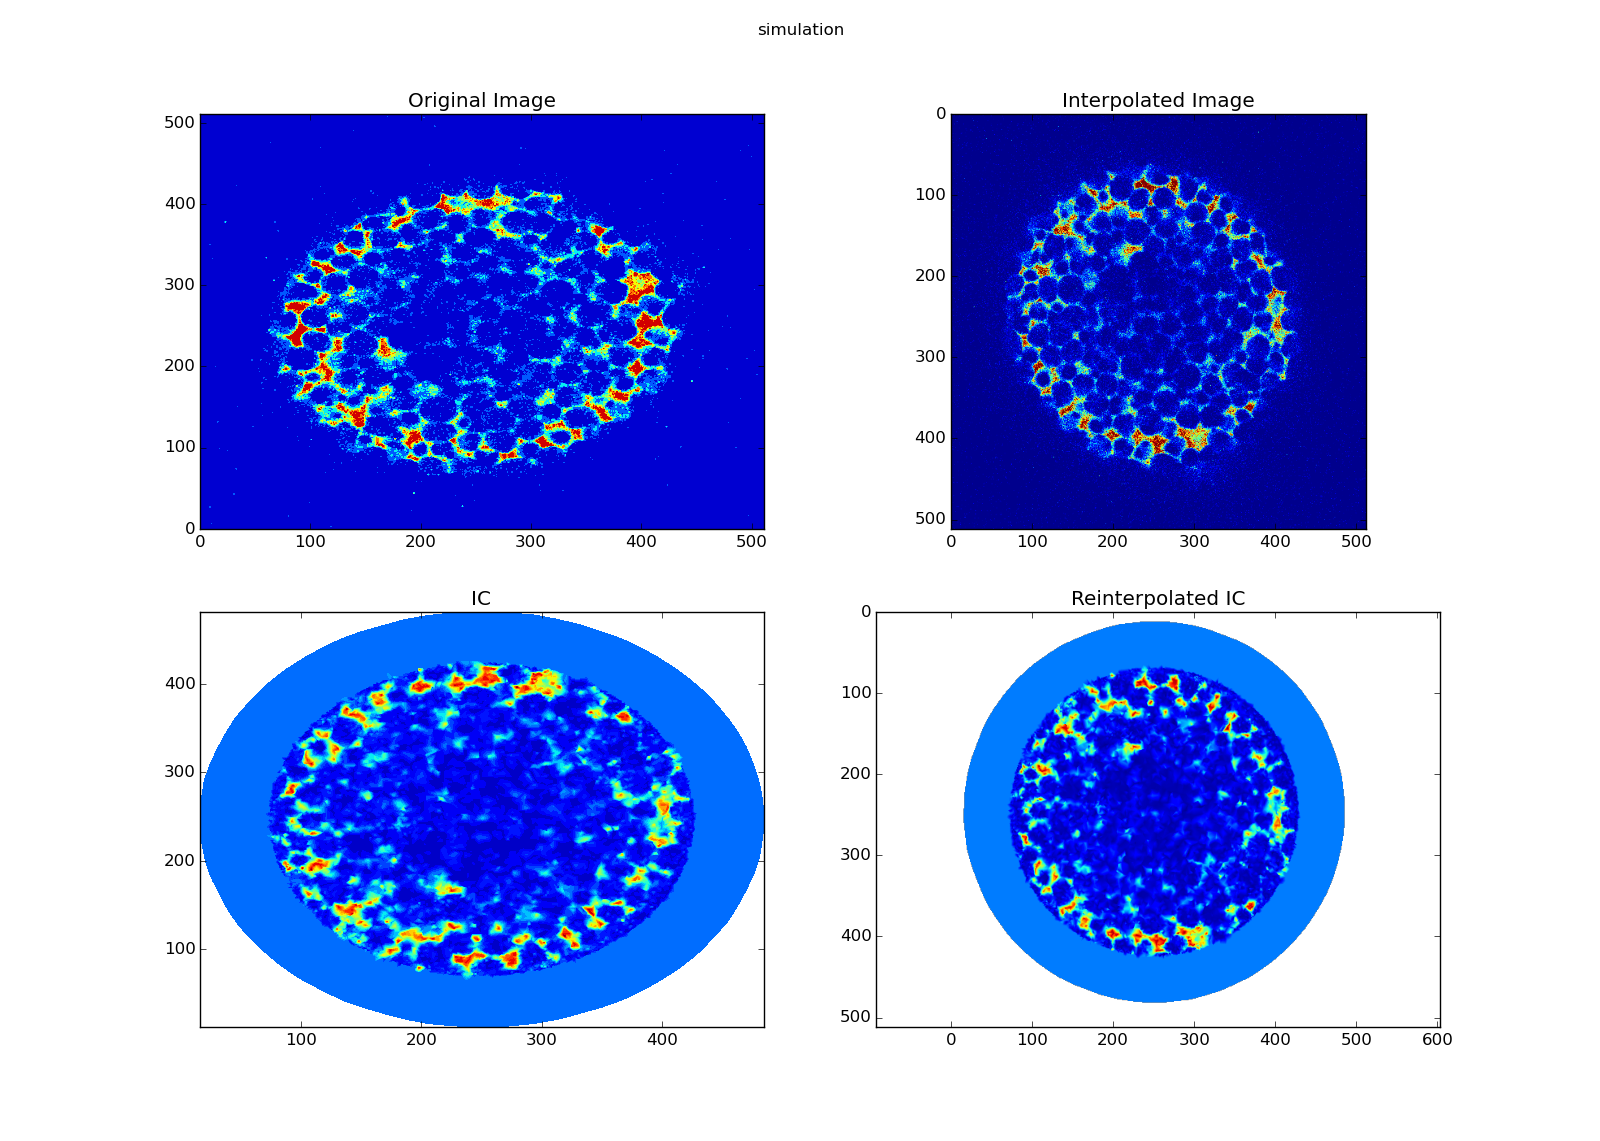
Keyword Arguments: - roi (pyfrp.subclasses.pyfrp_ROI.ROI) – A PyFRAP ROI.
- axes (matplotlib.axes) – List of axes of length 4.
Returns: List of axes.
Return type: list
-
computeInterpolatedICImg(roi=None)¶ Interpolates ICs back onto 2D image.
Uses
scipy.interpolate.griddata, see also http://docs.scipy.org/doc/scipy-0.14.0/reference/generated/scipy.interpolate.griddata.htmlIf
roiis specified, will only interpolate nodes of this ROI.Keyword Arguments: roi (pyfrp.subclasses.pyfrp_ROI.ROI) – A PyFRAP ROI. Returns: Tuple containing: - X (numpy.ndarray): Meshgrid x-coordinates.
- Y (numpy.ndarray): Meshgrid y-coordinates.
- interpIC (numpy.ndarray): Interpolated ICs.
Return type: tuple
-
computeInterpolatedSolutionToImg(vals, roi=None, method='linear')¶ Interpolates solution back onto 2D image.
Uses
scipy.interpolate.griddata, see also http://docs.scipy.org/doc/scipy-0.14.0/reference/generated/scipy.interpolate.griddata.htmlIf
roiis specified, will only interpolate nodes of this ROI.For more details about interpolation methods, check out https://docs.scipy.org/doc/scipy-0.14.0/reference/generated/scipy.interpolate.griddata.html .
Keyword Arguments: - vals (numpy.ndarray) – Solution to be interpolated.
- roi (pyfrp.subclasses.pyfrp_ROI.ROI) – A PyFRAP ROI.
- method (str) – Interpolation method.
- fillVal (float) – Value applied outside of ROI.
Returns: Tuple containing:
- X (numpy.ndarray): Meshgrid x-coordinates.
- Y (numpy.ndarray): Meshgrid y-coordinates.
- interpIC (numpy.ndarray): Interpolated solution.
Return type: tuple
-
getD()¶ Returns current diffusion coefficient used for simulation.
Returns: Current diffusion coefficient in \(\mathrm{px}^2/s\). Return type: float
-
getDegr()¶ Returns degradation rate used for simulation.
Returns: Current degradation rate in \(1/[c]s\). Return type: float
-
getICImgSmoothness()¶ Returns smoothness of initial condition.
See also
pyfrp.modules.pyfrp_img_module.getICImgSmoothness().Returns: Tuple containing: - s (float): Smoothmess coefficient.
- dmax(float): Maximum diff.
Return type: tuple
-
getICSmoothness(roi=None)¶ Returns smoothness of initial condition.
See also
getSolutionVariableSmoothness().Note
If
roi!=None, will only evaluate smoothness over this specific ROI.Keyword Arguments: roi (pyfrp.subclasses.pyfrp_ROI.ROI) – PyFRAP ROI. Returns: Tuple containing: - s (float): Smoothmess coefficient.
- dmax(float): Maximum diff.
Return type: tuple
-
getICimg()¶ Returns image for initial condition interpolation.
Returns: Current ICimg. Return type: numpy.ndarray
-
getIterations()¶ Returns current iterations.
Returns: Current solver Return type: str
-
getOptTvecSim(maxDExpectedPx)¶ Generates time vector that is optimal to fit experiments with expected diffusion coefficients up to
maxDExpectedPx.Basically computes how long a simulation needs to run in seconds to capture the dynamics of an experiment with diffusion coefficient of
maxDExpectedPx. Does this by setting end time point to\[t_{\mathrm{end,sim}} = \frac{D_{\mathrm{max. exp.}}}{D_{\mathrm{sim}}} t_{\mathrm{end,data}}\]Note
Keeps time scaling.
Parameters: maxDExpectedPx (float) – Maximum expected diffusion coefficient. Returns: New simulation time vector. Return type: numpy.ndarray
-
getProd()¶ Returns production rate used for simulation.
Returns: Current production rate in \(1/s\). Return type: float
-
getSaveSim()¶ Returns flag if simulation should be saved.
Returns: Current flag value. Return type: bool
-
getSolutionVariableSmoothness(vals, roi=None)¶ Returns smoothness of solution variable.
Smoothness \(s\) is computed as:
\[s=\frac{d_{\mathrm{max}}}{\bar{d}}\]where \(d_{\mathrm{max}}\) is the maximum derivative from the nearest neighbour over the whole array, and \(\bar{d}\) the average derivation. Derivative from nearest neighbour is computed by
\[d=\frac{c-c_\mathrm{nearest}}{||\textbf{x}-\textbf{x}_\mathrm{nearest}||_2}\]Note
If
roi!=None, will only evaluate smoothness over this specific ROI.Warning
Nearest neighbour finding algorithm is slow. Should be changed to
ckdTreeat some point.Keyword Arguments: roi (pyfrp.subclasses.pyfrp_ROI.ROI) – PyFRAP ROI. Returns: Tuple containing: - s (float): Smoothmess coefficient.
- dmax(float): Maximum diff.
Return type: tuple
-
getSolver()¶ Returns current solver.
Returns: Current solver Return type: str
-
getTolerance()¶ Returns current tolerance.
Returns: Current solver Return type: str
-
isLogTimeScale()¶ Returns if time spacing of simulation is logarithmic.
Returns: Time spacing is logarithmic. Return type: bool
-
mapOntoImgs(tvec=None, roi=None, fnOut='', showProgress=True, method='linear', fillVal=0.0, scale=True, enc='uint16')¶ Maps simulation solution back onto images.
See also
computeInterpolatedSolutionToImg().Note
Only works if simulation has been run before and saved via
saveSim.For more details about interpolation methods, check out https://docs.scipy.org/doc/scipy-0.14.0/reference/generated/scipy.interpolate.griddata.html .
Keyword Arguments: - tvec (numpy.ndarray) – Timepoints at which solution is saved to image.
- roi (pyfrp.subclasses.pyfrp_ROI.ROI) – PyFRAP ROI.
- fnOut (str) – Path where images should be saved.
- showProgress (bool) – Show progress of output.
- method (str) – Interpolation method.
- fillVal (float) – Value applied outside of ROI.
Returns: True if everything ran through, False else.
Return type: bool
-
plotICStack(ROIs, withGeometry=True, vmin=None, vmax=None, ax=None, colorbar=False)¶ Plots a stack of the initial conditions in a given list of ROIs.
Will automatically compute the direction in which ROI lies in the 3D space and reduce the ROI into this plane for contour plot.
If
vmin=Noneorvmax=None, will compute overall maximum and minimum values over all ROIs.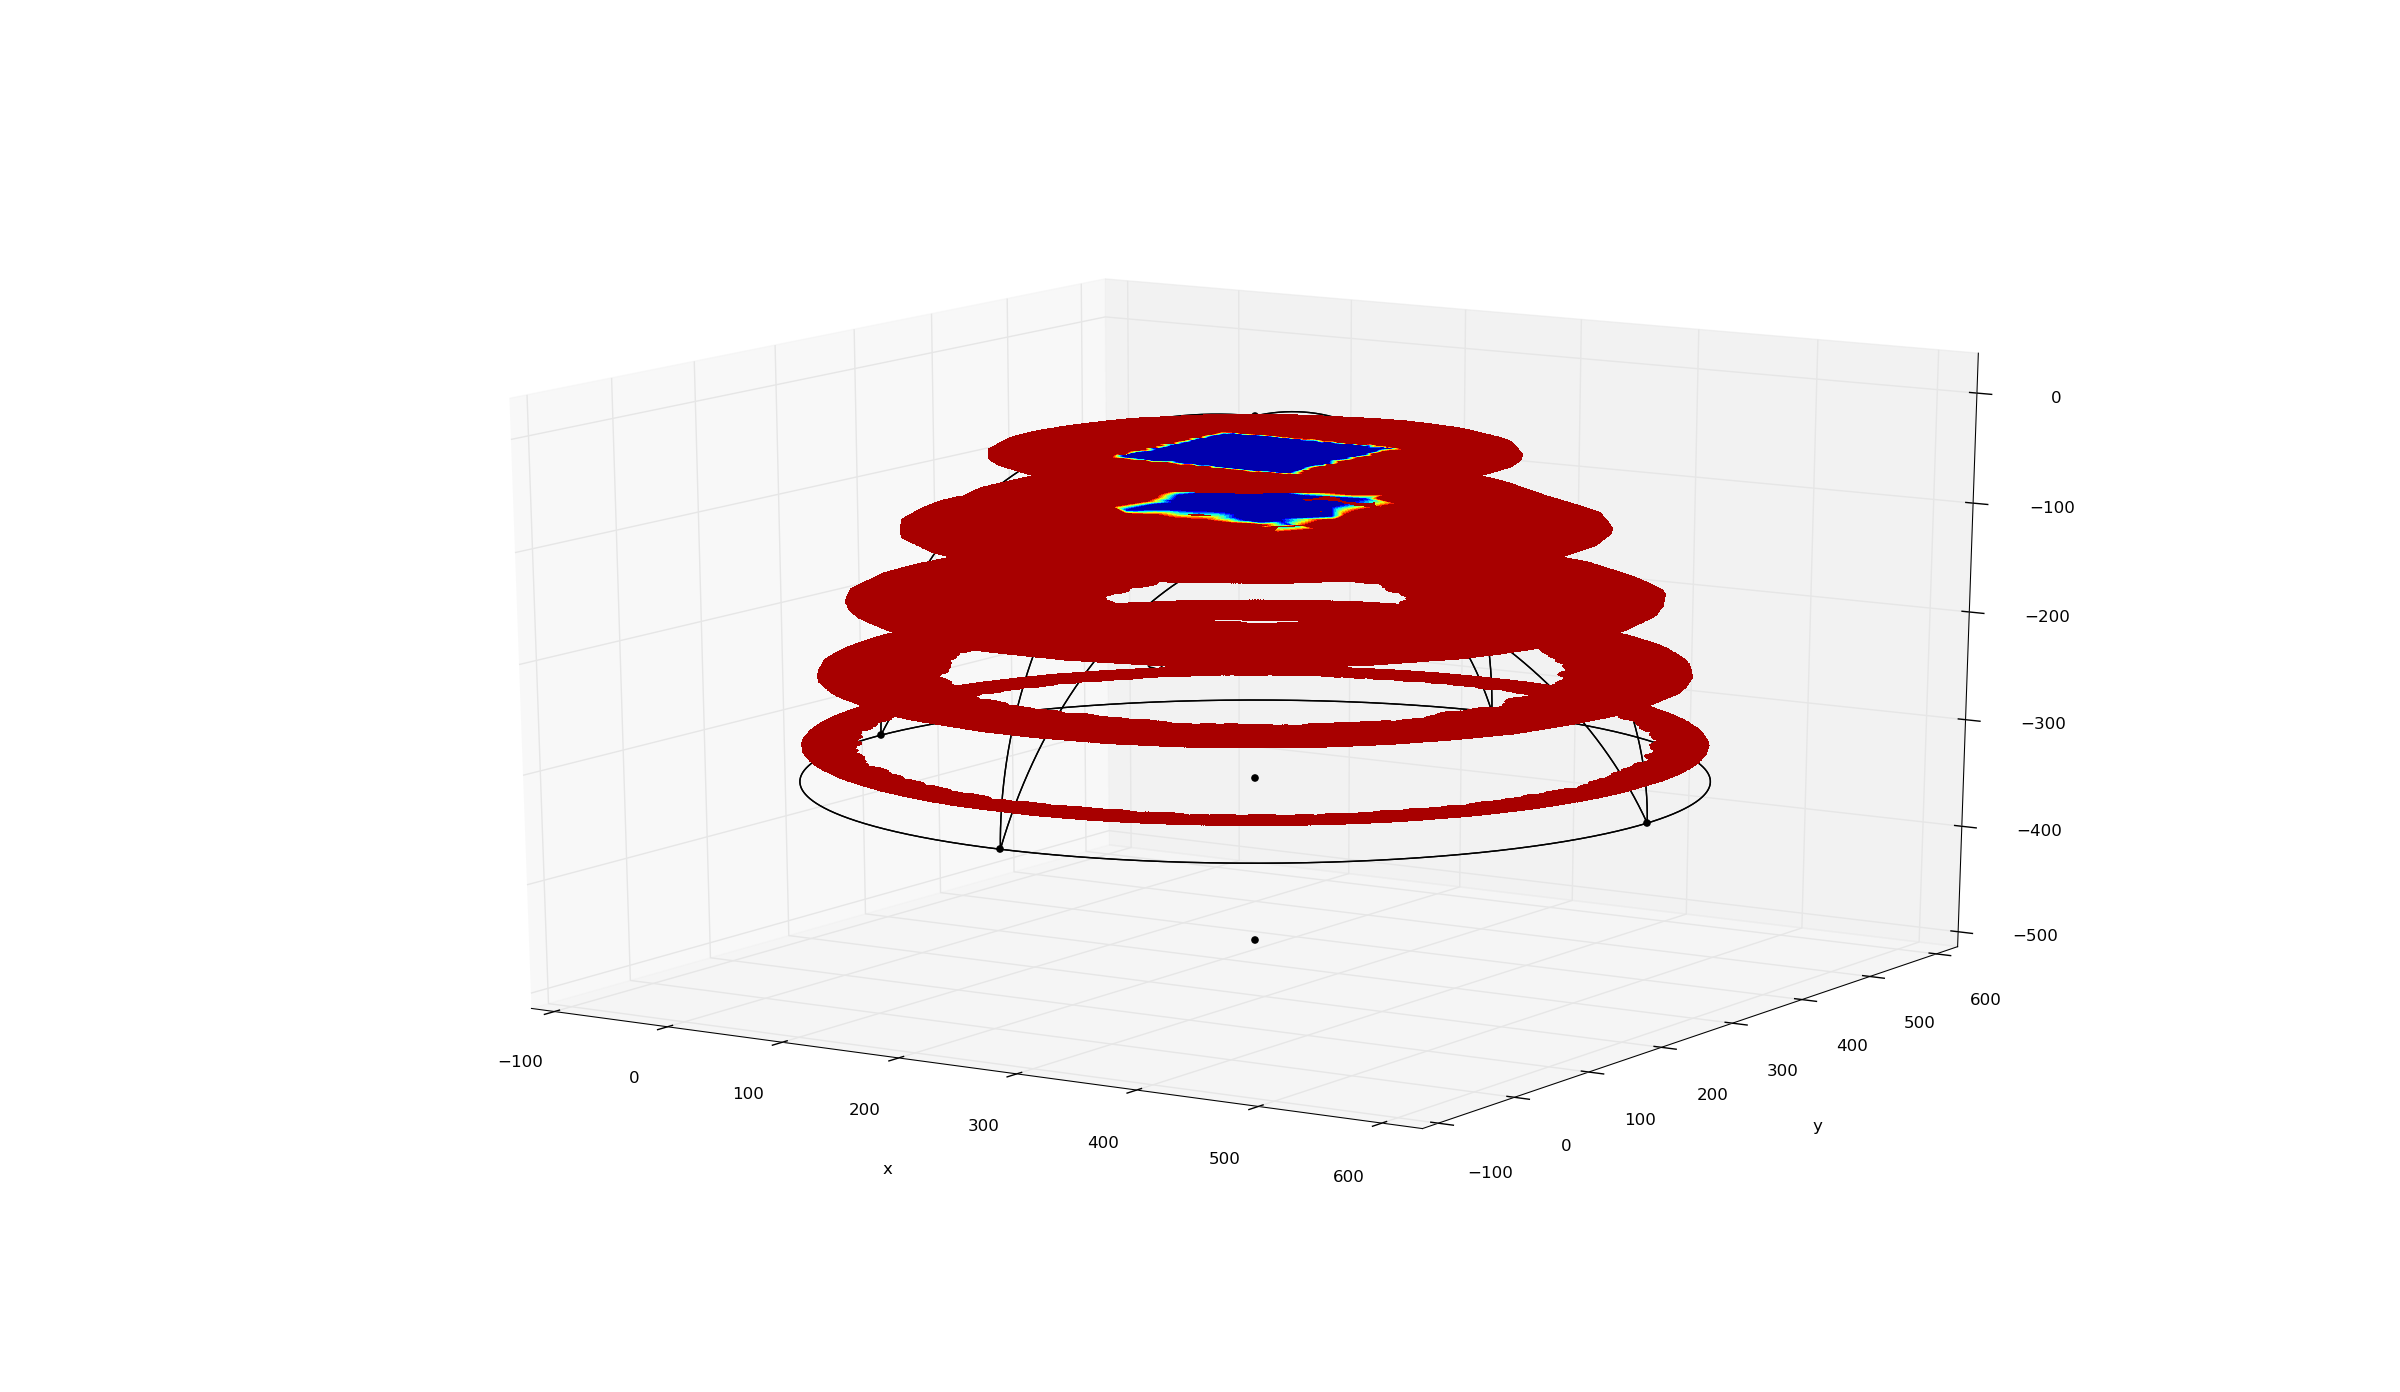
Parameters: - phi (fipy.CellVariable) – Simulation solution variable (or numpy array).
- ROIs (list) – List of
pyfrp.subclasses.pyfrp_ROI.ROIobjects.
Keyword Arguments: - withGeometry (bool) – Show geometry inside plot.
- vmin (float) – Overall minimum value to be displayed in plot.
- vmax (float) – Overall maximum value to be displayed in plot.
- ax (matplotlib.axes) – Axes used for plotting.
- colorbar (bool) – Display color bar.
Returns: Axes used for plotting.
Return type: matplotlib.axes
-
plotSolStack(phi, ROIs, withGeometry=True, vmin=None, vmax=None, ax=None, colorbar=False)¶ Plots a stack of the solution variable in a given list of ROIs.
Will automatically compute the direction in which ROI lies in the 3D space and reduce the ROI into this plane for contour plot.
If
vmin=Noneorvmax=None, will compute overall maximum and minimum values over all ROIs.Parameters: - phi (fipy.CellVariable) – Simulation solution variable (or numpy array).
- ROIs (list) – List of
pyfrp.subclasses.pyfrp_ROI.ROIobjects.
Keyword Arguments: - withGeometry (bool) – Show geometry inside plot.
- vmin (float) – Overall minimum value to be displayed in plot.
- vmax (float) – Overall maximum value to be displayed in plot.
- ax (matplotlib.axes) – Axes used for plotting.
- colorbar (bool) – Display color bar.
Returns: Axes used for plotting.
Return type: matplotlib.axes
-
printAllAttr()¶ Prints out all attributes of embryo object.
-
rerun(signal=None, embCount=None, showProgress=True, debug=False)¶ Reruns simulation.
Note
Only works if simulation has been run before with
saveSimenabled.See also
pyfrp.modules.pyfrp_sim_module.rerunReactDiff().Keyword Arguments: - signal (PyQt4.QtCore.pyqtSignal) – PyQT signal to send progress to GUI.
- embCount (int) – Counter of counter process if multiple datasets are simulated.
- debug (bool) – Print debugging messages and show debugging plots.
- showProgress (bool) – Print out progress.
Returns: Updated simulation instance.
Return type:
-
restoreDefaults()¶ Restores default parameters for simulations.
-
run(signal=None, embCount=None, showProgress=True, debug=False)¶ Runs simulation.
Checks if ROI indices are computed, if not, computes them. Then passes simulation object to
pyfrp.modules.pyfrp_sim_module.simulateReactDiff().Keyword Arguments: - signal (PyQt4.QtCore.pyqtSignal) – PyQT signal to send progress to GUI.
- embCount (int) – Counter of counter process if multiple datasets are simulated.
- debug (bool) – Print debugging messages and show debugging plots.
- showProgress (bool) – Print out progress.
Returns: True if success, False otherwise.
Return type: bool
-
setBleachedROI(r)¶ Sets bleached ROI that is used when ideal ICs (ICmode=4) is selected.
Parameters: r (pyfrp.subclasses.pyfrp_ROI.ROI) – ROI to be set bleached ROI.
-
setD(D)¶ Sets diffusion coefficient used for simulation.
Parameters: D (float) – New diffusion coefficient in \(\mu\mathrm{m}^2/s\). Returns: New diffusion coefficient in \(\mathrm{px}^2/s\). Return type: float
-
setDegr(degr)¶ Sets degradation rate used for simulation.
Parameters: prod (float) – New degradation rate in \(1/[c]s\). Returns: New degradation rate in \(1/[c]s\). Return type: float
-
setICMode(m)¶ Sets the mode of initial conditions.
Initial condition modes are defined as:
- 0: ROI-based: Mesh nodes get assigned the value of the first entry
dataVecof the ROI covering them. Note: If a mesh node is covered by two ROIs, will assign the value of the ROI that is last in embryo’sROIslist. See alsopyfrp.modules.pyfrp_sim_module.applyROIBasedICs(). - 1: Radial: Concentrations get radially approximated around some center.
See also
pyfrp.modules.pyfrp_sim_module.applyRadialICs(). - 2: Imperfect: Interpolates
ICimgonto mesh, fills nodes that are not covered by image withembryo.analysis.concRimand then mimics imperfect bleaching via sigmoid function in z-direction. See alsopyfrp.modules.pyfrp_sim_module.applyImperfectICs(). - 3: Inpterpolated: Interpolates
ICimgonto mesh, fills nodes that are not covered by image withembryo.analysis.concRim. See alsopyfrp.modules.pyfrp_sim_module.applyInterpolatedICs(). - 4: Ideal: Ideal ICs, that is, single value inside and single value outside of bleached region.
See also
pyfrp.modules.pyfrp_sim_module.applyIdealICs(),setValOut()andsetBleachedROI().
Note
The default mode is Interpolated (
m=3) and is highly recommended to obtain most realistic results.Parameters: m (int) – Which mode to be used. Returns: Current initial condition mode used. Return type: int - 0: ROI-based: Mesh nodes get assigned the value of the first entry
-
setICimg(img)¶ Sets image for initial condition interpolation.
Parameters: img (numpy.ndarray) – A 2D image. Returns: New ICimg. Return type: numpy.ndarray
-
setICimgByFn(fn)¶ Sets image for initial condition interpolation given a filepath.
Parameters: fn (str) – Path to file. Returns: New ICimg. Return type: numpy.ndarray
-
setIterations(tol)¶ Sets iterations of solver.
Parameters: tol (float) – New iterations. Returns: Current iterations. Return type: float
-
setMesh(m)¶ Sets mesh to a new mesh object.
Parameters: m (pyfrp.subclasses.pyfrp_mesh.mesh) – PyFRAP mesh object. Returns: Updated mesh instance. Return type: pyfrp.subclasses.pyfrp_mesh.mesh
-
setProd(prod)¶ Sets production rate used for simulation.
Parameters: prod (float) – New production rate in \(1/s\). Returns: New production rate in \(1/s\). Return type: float
-
setSaveSim(b)¶ Sets flag if simulation should be saved.
Parameters: b (bool) – New flag value. Returns: Updated flag value. Return type: bool
-
setSolver(solver)¶ Sets solver to use.
Implemented solvers are:
- PCG
- LU
Parameters: solver (str) – Solver to use. Returns: Current solver Return type: str
-
setTEnd(T)¶ Updates timevector of simulation to end at new time point.
Note
Keeps scaling.
Parameters: T (float) – New end timepoint. Returns: New simulation time vector. Return type: numpy.ndarray
-
setTimesteps(n)¶ Sets number of simulation time steps and updates time vector.
Parameters: n (int) – New number of time steps. Returns: New number of time steps. Return type: int
-
setTolerance(tol)¶ Sets tolerance of solver.
Parameters: tol (float) – New tolerance. Returns: Current tolerance. Return type: float
-
setValOut(v)¶ Sets valOut that is used when ideal ICs (ICmode=4) is selected.
Parameters: v (float) – Value that is to assigned outside of bleachedROI.
-
showIC(ax=None, roi=None, nlevels=25, vmin=None, vmax=None, typ='contour')¶ Plots initial conditions applied to mesh in 2D or 3D.
If
roiis given, will only plot initial conditions for nodes inside ROI, else will plot initial condition for all nodes in mesh.Note
Simulation needs to be run first before this plotting function can be used.
Example:
>>> simulation.plotIC(typ='contour')
will produce the following:
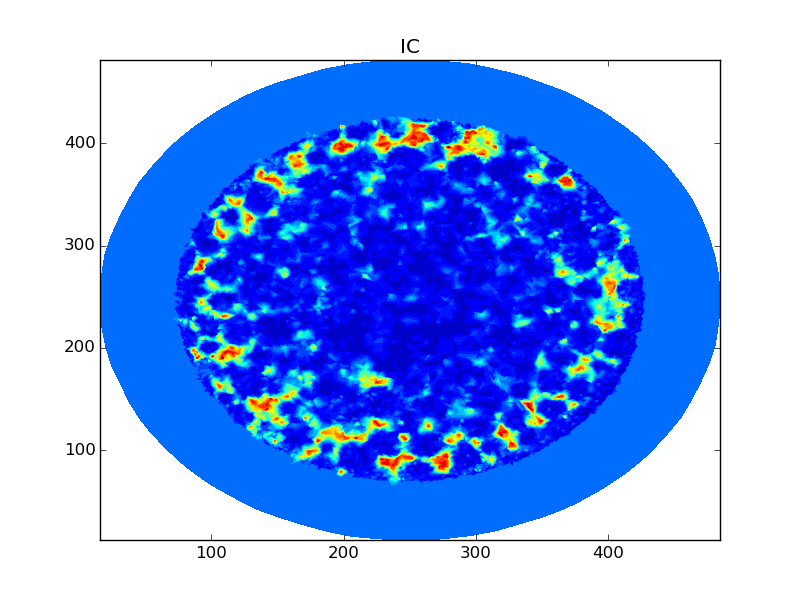
See also
pyfrp.modules.pyfrp_plot_module.plotSolutionVariable()andpyfrp.subclasses.pyfrp_ROI.plotSolutionVariable().Keyword Arguments: - roi (pyfrp.subclasses.pyfrp_ROI.ROI) – A PyFRAP ROI object.
- vmin (float) – Overall minimum value to be displayed in plot.
- vmax (float) – Overall maximum value to be displayed in plot.
- ax (matplotlib.axes) – Axes used for plotting.
- nlevels (int) – Number of contour levels to display.
- typ (str) – Typ of plot.
Returns: Axes used for plotting.
Return type: matplotlib.axes
-
showICimg(ax=None, typ='contour', colorbar=True)¶ Plots image used for initial 2D.
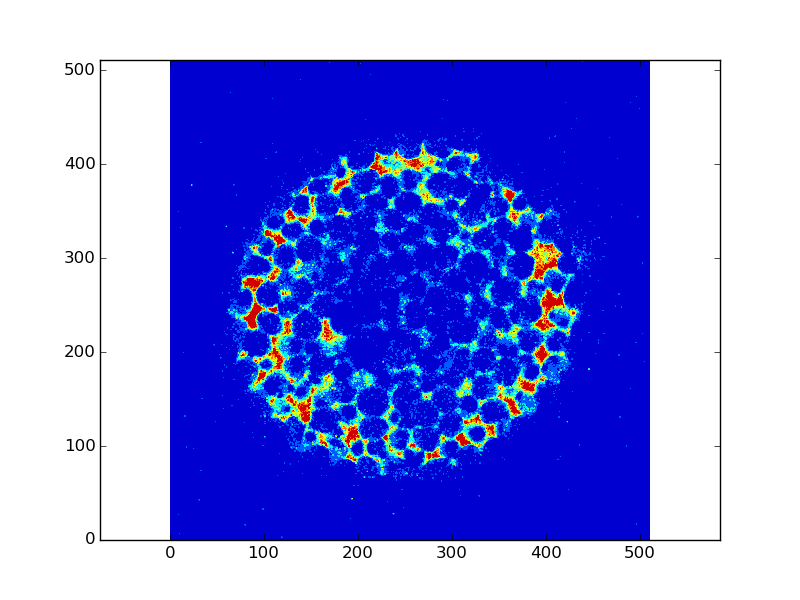
Keyword Arguments: ax (matplotlib.axes) – Axes used for plotting. Returns: Axes used for plotting. Return type: matplotlib.axes
-
showInterpolatedIC(ax=None, roi=None)¶ Shows ICs interpolated back onto 2D image.
If
roiis specified, will only interpolate nodes of this ROI.See also
computeInterpolatedIC().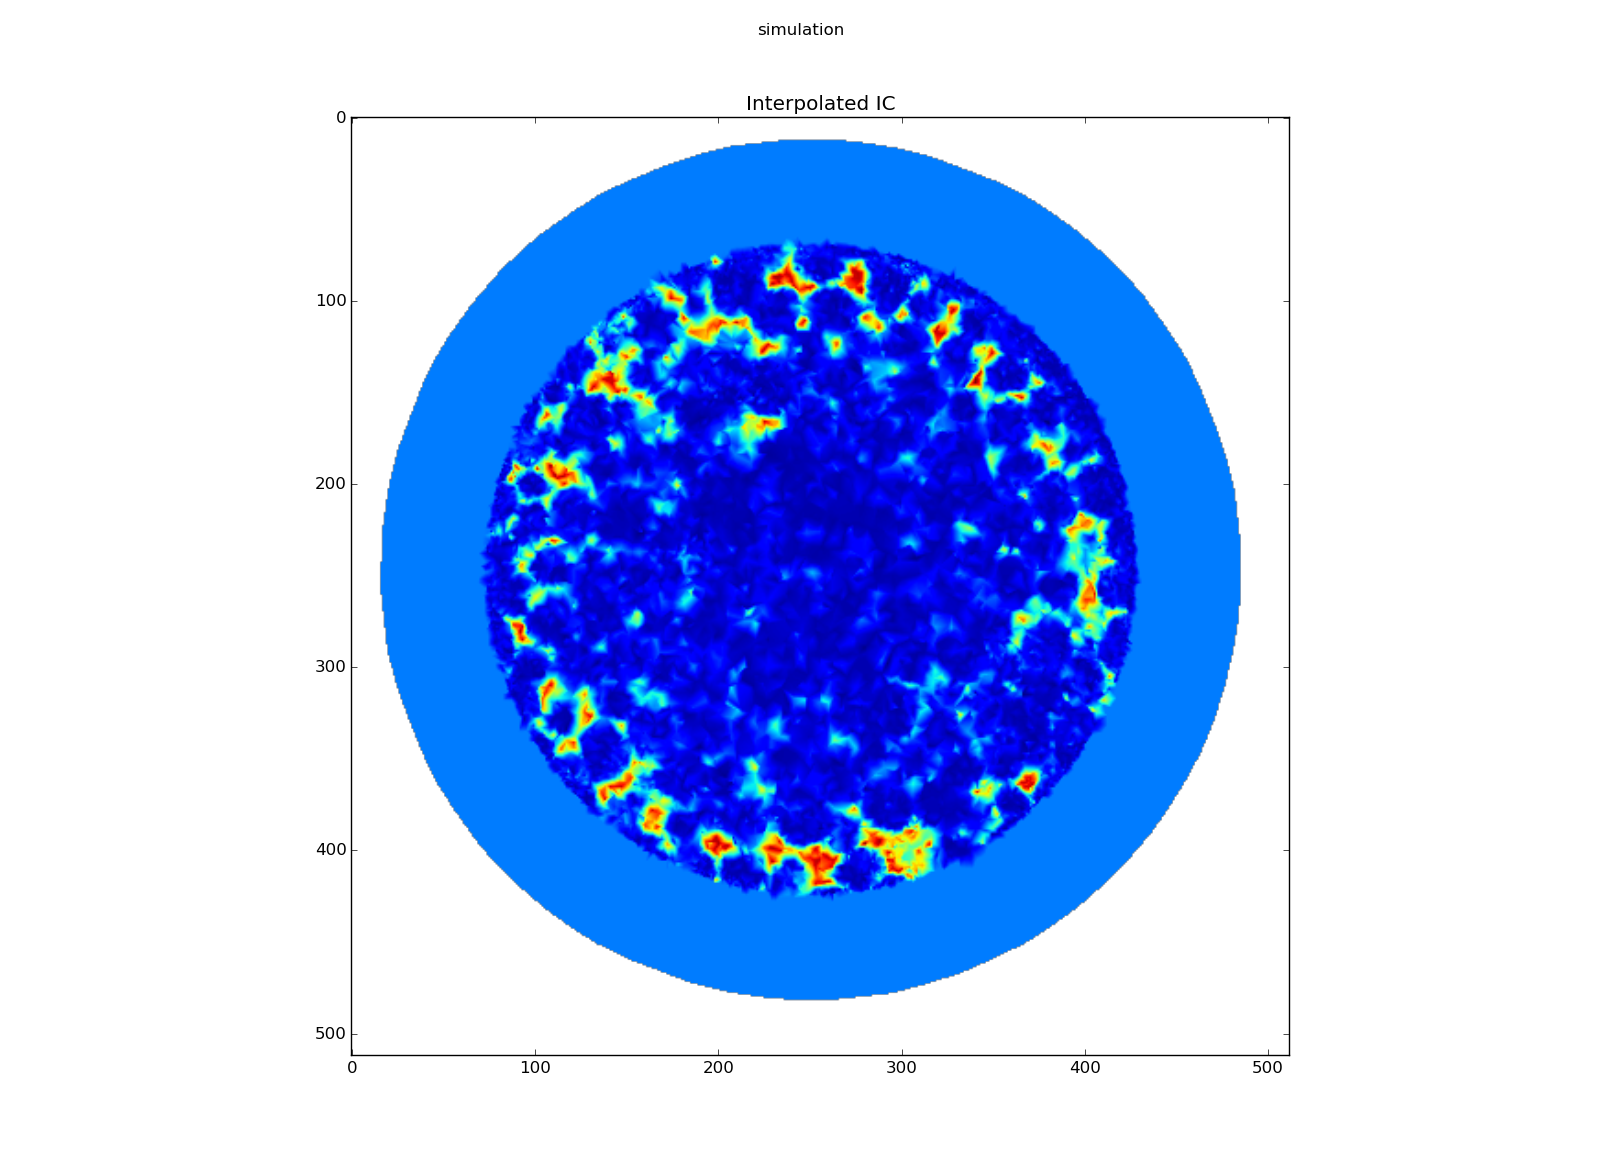
Keyword Arguments: - roi (pyfrp.subclasses.pyfrp_ROI.ROI) – A PyFRAP ROI.
- ax (matplotlib.axes) – Axes to be used for plotting.
Returns: Axes used for plotting.
Return type: matplotlib.axes
-
showInterpolatedICImg(ax=None)¶ Shows interpolation of initial condition image.
See also
computeInterpolatedICImg().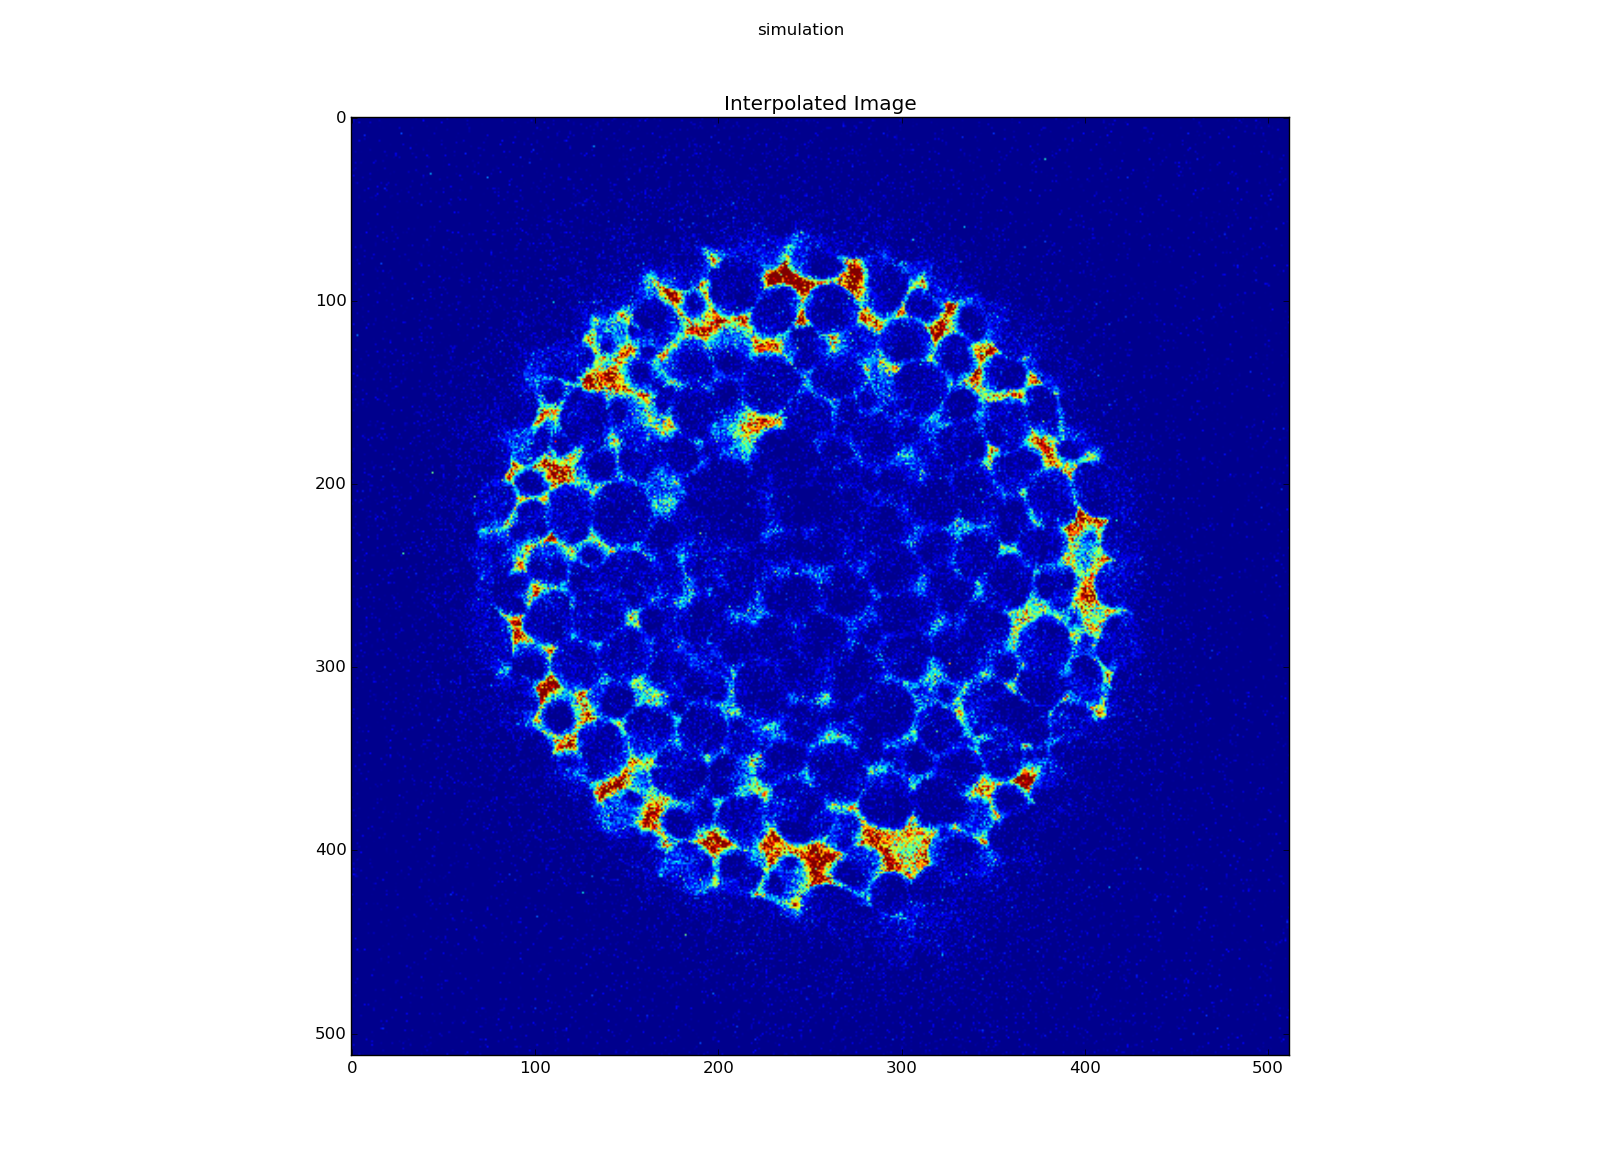
Keyword Arguments: ax (matplotlib.axes) – Axes to be used for plotting. Returns: Axes used for plotting. Return type: matplotlib.axes
-
toDefaultTvec()¶ Sets time vector for simulation to default range.
Default range is given by
tStartandtEndinembryoobject and is linearly scaled.Returns: New simulation time vector. Return type: numpy.ndarray
-
toLinearTimeScale()¶ Converts time vector for simulation to linear scale.
Returns: New simulation time vector. Return type: numpy.ndarray
-
toLogTimeScale(spacer=1e-10)¶ Converts time vector for simulation to logarithmic scale.
Keyword Arguments: spacer (float) – Small offset to avoid log(0). Returns: New simulation time vector. Return type: numpy.ndarray
-
updateTvec()¶ Updates time vector for simulation to match experiment start and end time.
Does not change scaling of time vector.
Returns: New simulation time vector. Return type: numpy.ndarray
-
updateVersion()¶ Updates simulation object to current version, making sure that it possesses all attributes.
Creates a new simulation object and compares
selfwith the new simulation object. If the new simulation object has a attribute thatselfdoes not have, will add attribute with default value from the new simulation object.Returns: selfReturn type: pyfrp.subclasses.pyfrp_simulation.simulation
-
Module contents
PyFRAP: A Python based FRAP analysis tool box. Subclass module.